FIGURE 3.
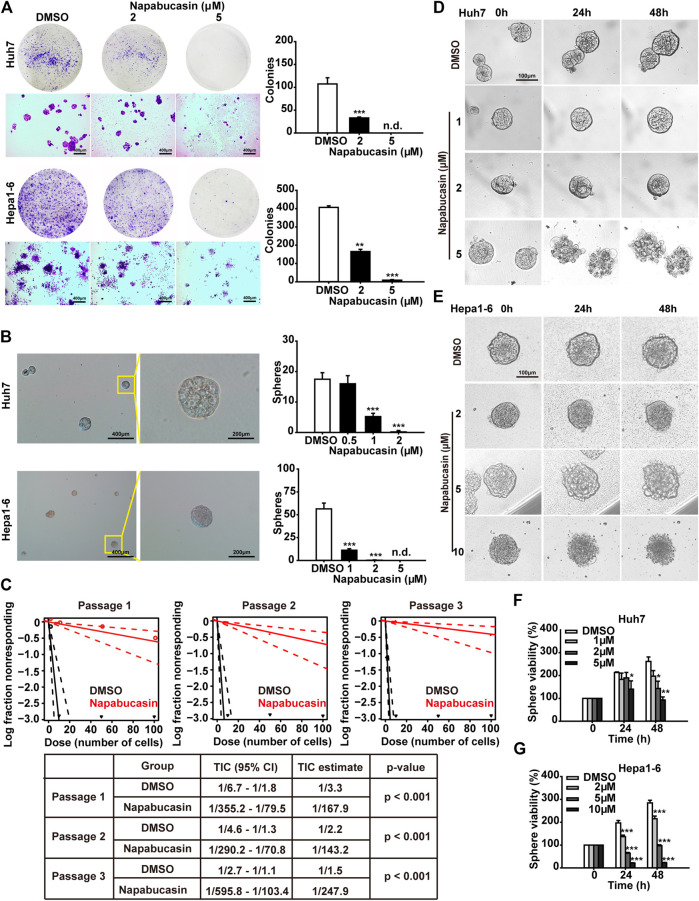
Napabucasin suppresses sphere formation and viability of HCC cells. (A) Representative images of crystal violet-stained colonies (>100 cells) of Huh7 and Hepa1-6 cells after treatment with DMSO or indicated concentrations of napabucasin. (B) Representative images of multicellular spheroids larger than 80 μm (left) and quantification of spheroids derived from DMSO- or napabucasin-treated Huh7 and Hepa1-6 cells (right). n.d., not detected. (C) Limiting dilution sphere assay of Huh7 cells under DMSO or 1 µM napabucasin from passage one to three. ELDA analysis plot and relative table reporting the TIC percentage and estimation are shown. TIC: tumor-initiating cells. (D), (E). Representative real-time images of Huh7 and Hepa1-6 spheroids in the presence of DMSO or napabucasin. (F), (G). Viability of the DMSO or napabucasin-treated spheroids after 24 or 48 h. Data are shown as mean ± SD of three independent experiments (*P < 0.05, **P < 0.01 and ***P < 0.001).

