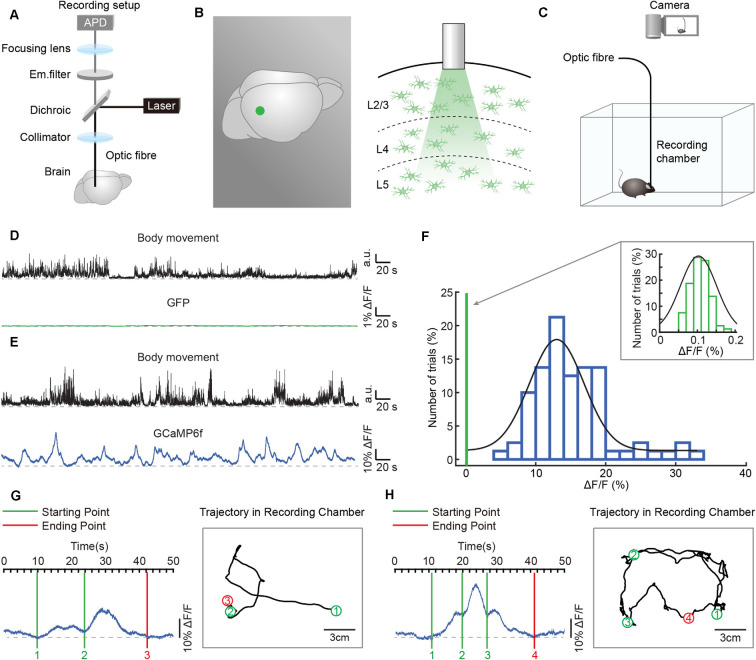
Figure 2.
Simultaneous recordings of astrocytic Ca2+ transients and body movements during a freely behaving state. (A) Scheme of the optic fiber recording setup. (B) Schematic showing the location (left panel: green point) and the tip of the optic fiber (diameter: 200 μm) implanted in layer 2/3 of the auditory cortex (right panel). (C) Schematic of the recording setup in which astrocytic Ca2+ transients and behavior were recorded simultaneously. (D) Example showing body movements (black traces) and simultaneously recorded fluorescence (green trace) of the AAV5-GfaABC1D-PI-Lck-GFP-SV40-injected group. (E) Example showing body movements (black traces) and simultaneously recorded astrocytic Ca2+ transients (blue trace) of the AAV5-GfaABC1D-cyto-GCaMP6f-SV40-injected group. (F) Distributions of the amplitudes of GCaMP6f fluorescence (blue histogram) and GFP fluorescence (upper right, green histogram, which is expanded from the green line on the left of the blue histogram). Both histograms fit Gaussian distributions. The mean values were 15.27% ΔF/F in the GCaMP6f group and 0.11% ΔF/F in the GFP group. (G,H) Examples showing the trial by trial correlation between the starting/ending points of astrocytic Ca2+ transients (left) and specific locations of freely behaving mice (right). Circles (green/red) and black lines indicate the positions where astrocytic Ca2+ transients start/end and the trajectories of the mice, respectively. The rectangular gray boxes indicate the recording chamber. Data is from two different mice.

