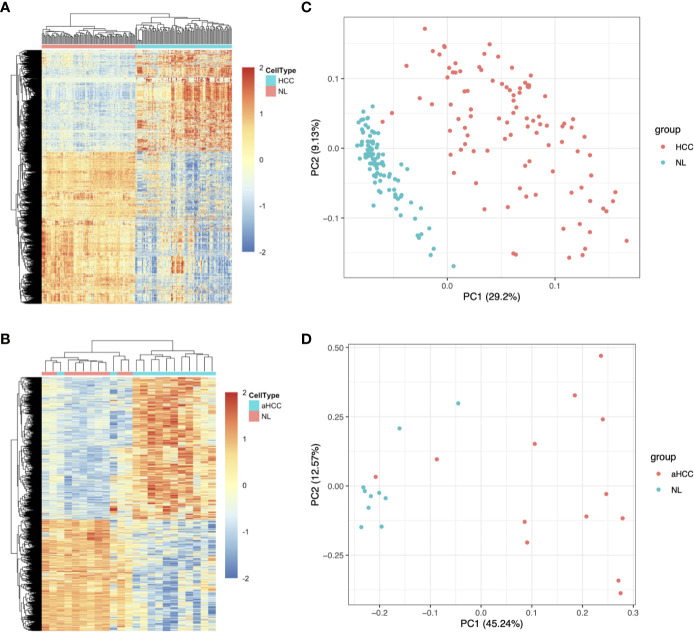
Figure 1.
Upregulated and downregulated DEG distribution in HCC samples based on the GSE22058 and GSE54238 datasets. (A, B) DEG hierarchical clustering analysis. All the data input represents the log2 ratio of HCC intensity relative to the normal intensity. The red color represents markedly upregulated genes selected at p <0.05; the blue color represents markedly downregulated genes at p <0.05. (C, D) PCA was performed to separate HCC from nontumor samples. aHCC, advanced hepatocellular carcinoma.

