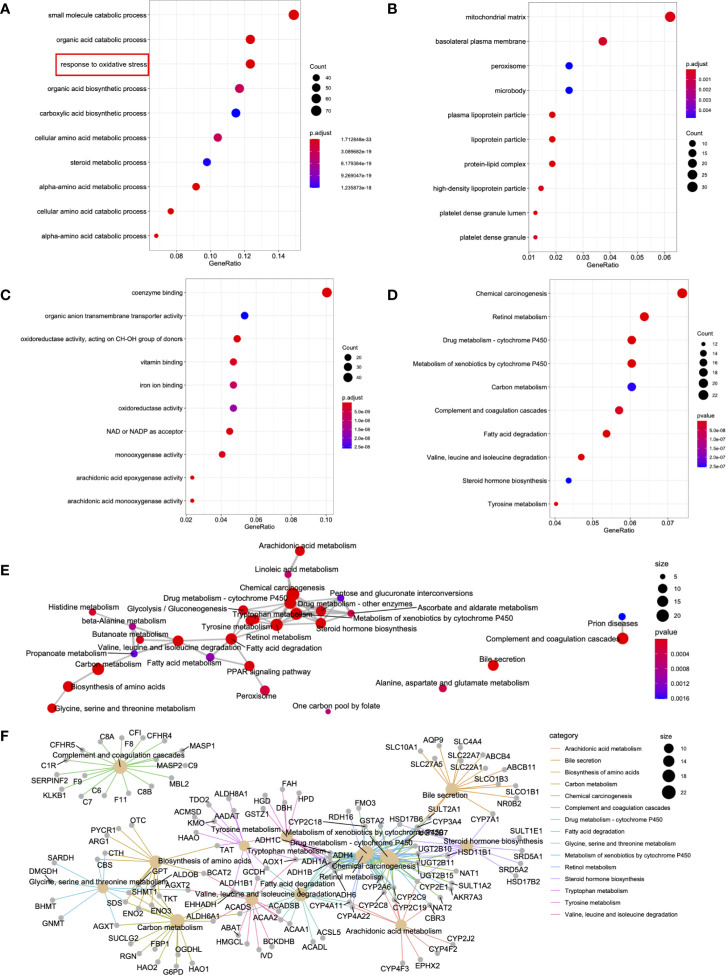
Figure 3.
DEG functional enrichment in the MEturquoise module. (A–D) The 10 GO terms and pathways with the greatest significance are shown. (E) The markedly altered pathways were connected to display the connections. The circle size in the network is directly proportional to the weighted connectivity degree. (F) Relationships of those markedly altered DEGs and pathways. The circle size represents the connection number between genes and pathways.

