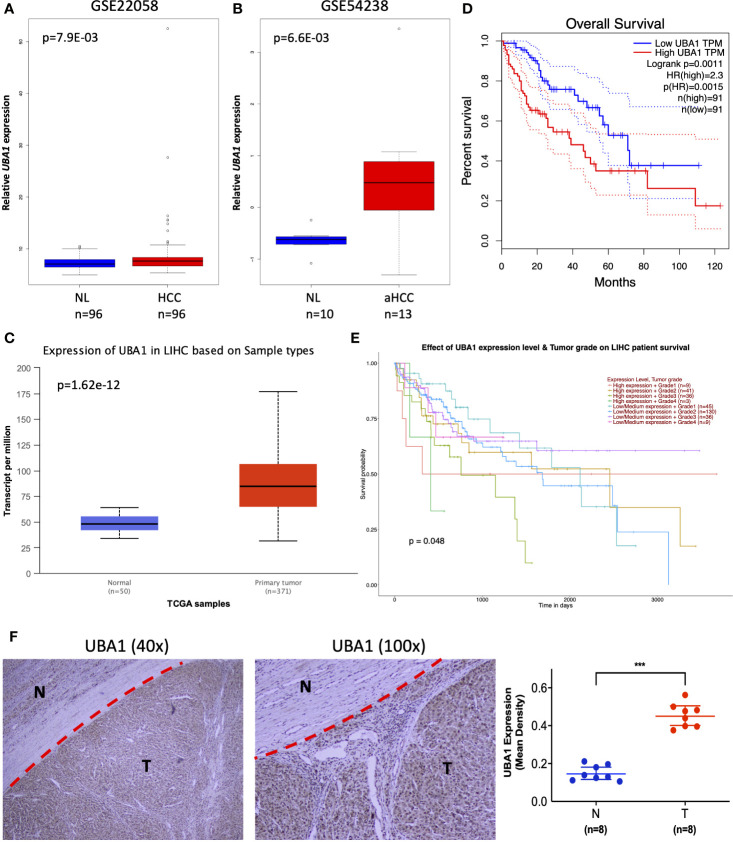
Figure 6.
Clinical implication of UBA1. (A–C) The UBA1 expression levels are shown in GSE22058 (n=192), GSE54238 (n=23), and TCGA HCC data (n=421). (D) Kaplan–Meier survival curve of differentially expressed UBA1 (HR=1.49; p=0.026). The red dotted line above the red curve and red dotted line below represent the high (50%) and low cutoff (50%) on the survival curve. The blue dotted line above the blue curve and blue dotted line below represent high (50%) and low cutoffs (50%) on the survival curve. (E) Differentially expressed UBA1 is associated with HCC grade (p=0.048). (F) Representative images (left) and quantification (right) of UBA1 immunohistochemical staining in eight HCC and paired nontumor tissues, ***p < 0.001.

