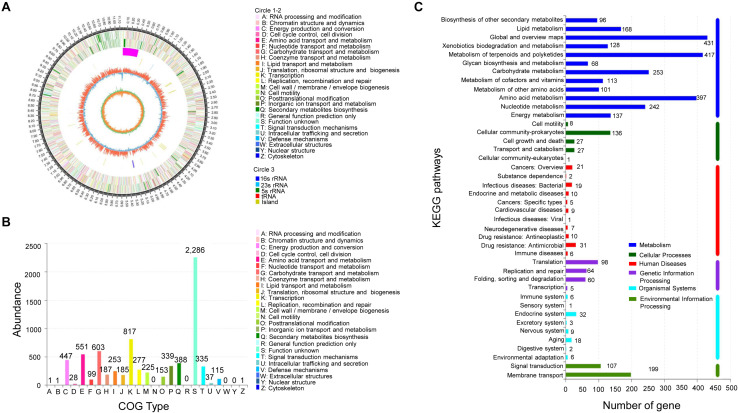
FIGURE 4.
Analysis of genome structure and metabolic pathway of strain JBS5-6. (A) Circular map of strain JBS5-6 chromosome. From outside to center, rings 1 and 4 show protein-coding genes colored by COG categories on forward/reverse strand. Rings 2 and 3 showed CDS, tRNA, and rRNA on forward/reverse strand. Ring 5 represented the G + C content, followed by G + C skew in ring 6. (B) COG annotation of strain JBS5-6 genome. (C) Pathway annotation of strain JBS5-6 genome according to the KEGG database. The vertical axis represented the level two classification of KEGG pathway. The horizontal axis represented the gene number annotated in this classification. Different colors of the columns represented different classifications of KEGG pathway.

