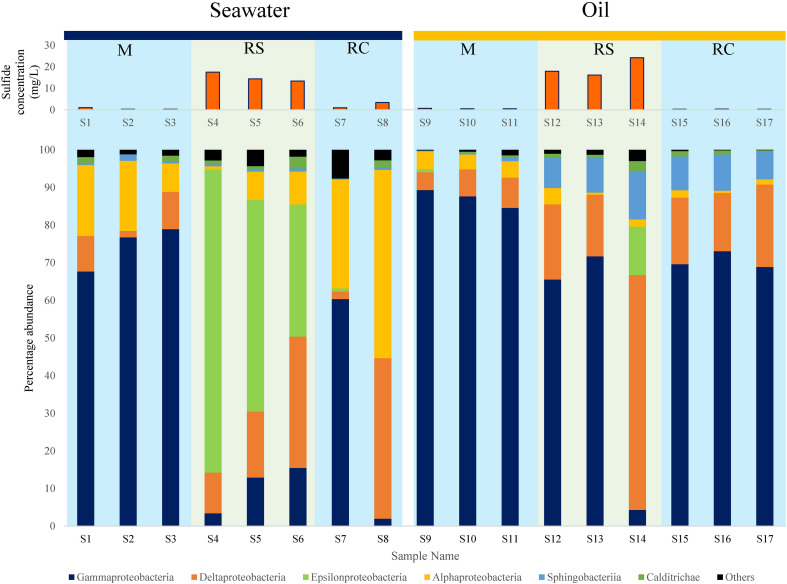
FIGURE 2.
Distribution of different bacterial classes along with corresponding average sulfide generation across M (mitigation), RS (rebound sulfidogenesis), and RC (rebound control) phases in SWCs and OWCs. The blue boxes in the background represent non-sour phases, whereas the green boxes represent sour phases.

