Figure 4.

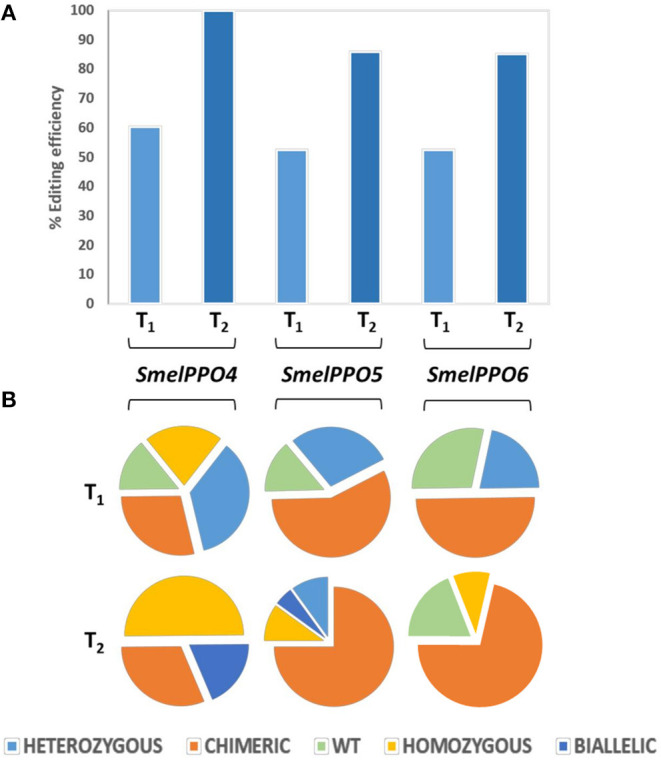
Genotyping of targeted gene mutations induced by CRISPR/Cas9 in the T1 and T2 generations. (A) Mutagenesis frequencies for all three targeted loci in T1 and T2 progenies. (B) Zygosity of targeted gene mutations in T1 and T2 populations.

Genotyping of targeted gene mutations induced by CRISPR/Cas9 in the T1 and T2 generations. (A) Mutagenesis frequencies for all three targeted loci in T1 and T2 progenies. (B) Zygosity of targeted gene mutations in T1 and T2 populations.