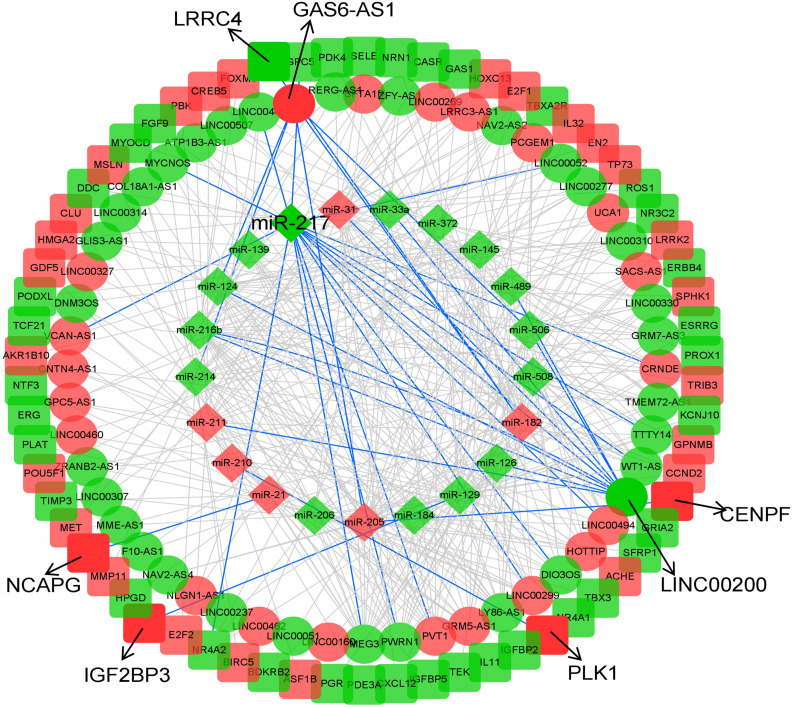
FIGURE 2.
CeRNA network of KIRP. The diamonds indicate miRNAs, oval mean lncRNAs, and square represent mRNAs. Red means up-regulated, and green means down-regulated. The arrow indicates the eight biomarkers of KIRP screened in this study, and the interactions they involved in are shown in blue lines.

