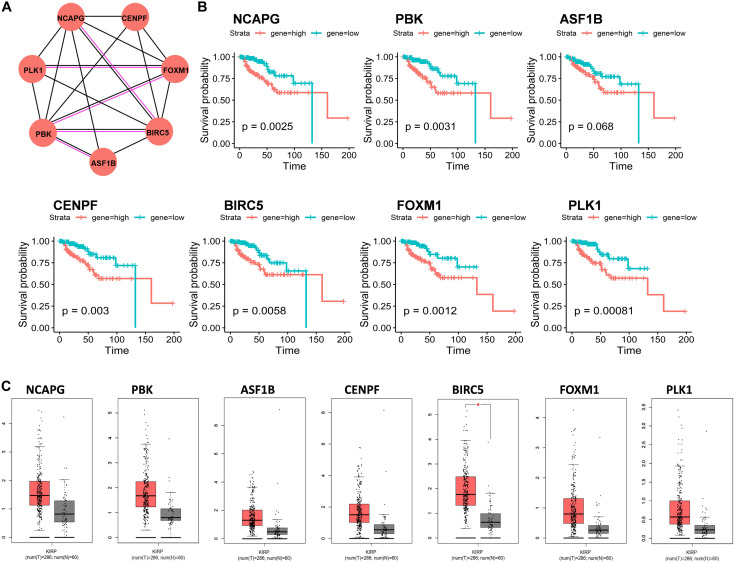
FIGURE 3.
Protein–protein interaction (PPI) network analysis of mRNAs in ceRNA network. (A) Seven genes interaction network. Circles indicate the genes in the PPI network, and the connection indicates the potential interaction between different mRNAs. The red line means physical interaction, and the black line means co-expression. (B) Overall survival curves of the seven genes in KIRP. *p < 0.05. (C) Gene expression of seven hub genes between KIRP tumor and normal tissues.

