Figure 2.
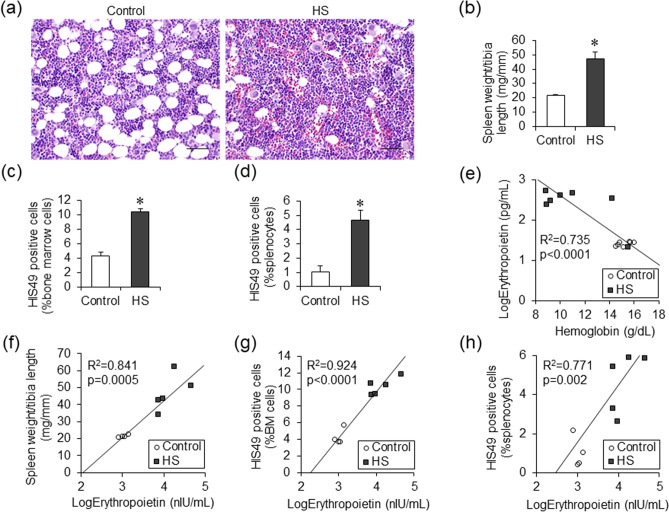
Bone marrow and splenic hematopoiesis in Dahl/SS rats. Hematoxylin and eosin staining of femur bone marrow in the control and the HS groups (a). (bars 50 μm) Spleen weight (b), the percentage of HIS49 positive cells in femur bone marrow cells (c) and splenocytes (d) in the control (n = 4) and the HS (n = 5) groups. The correlation of hemoglobin levels and serum erythropoietin levels in the control (n = 7) and the HS (n = 7) groups (e). The correlation of serum erythropoietin levels and spleen weight (f), the percentage of HIS49 positive cells in femur bone marrow cells (g), and those in splenocytes (h) in the control (n = 4) and the HS (n = 5) groups. Statistical analysis was performed using unpaired Student’s t test in (b), (c), (d). The associations between two parameters were analyzed using Pearson’s correlation coefficient in (e), (f), (g) and (h) by JMP Pro Version 14.2.0 software (SAS Institute Inc.). *p < 0.05 vs. the control group.

