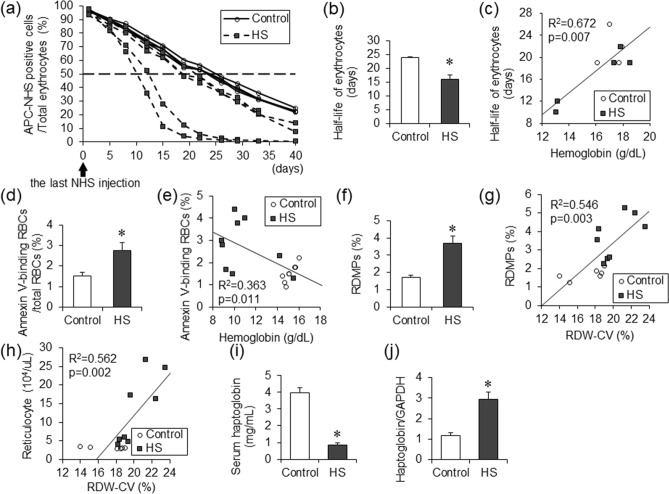
Figure 3.
Half-life of erythrocytes in Dahl/SS rats. The decay curves of erythrocytes were expressed as the percentage of APC-NHS positive cells in total erythrocytes after the last Sulfo-NHS-Biotin injection in the control (n = 4) and the HS (n = 5) groups (a). The half-life of erythrocytes in the control (n = 4) and the HS (n = 5) groups (b). The correlation between the hemoglobin level and the half-life of erythrocytes in the control (n = 4) and the HS (n = 5) groups (c). The percentage of annexin V-binding erythrocytes in total erythrocytes in the control (n = 8) and the HS (n = 9) groups (d). The correlation between the hemoglobin level and the percentage of annexin V-binding erythrocytes in total erythrocytes in the control (n = 8) and the HS (n = 9) groups (e). The percentage of RDMPs in total erythrocytes in the control (n = 6) and the HS (n = 8) groups (f). The correlation of RDW-CV and the proportion of RDMPs in total erythrocytes in the control (n = 6) and the HS (n = 8) groups (g). The correlation between RDW-CV and the number of reticulocytes in the control (n = 6) and the HS (n = 8) groups (h). The serum haptoglobin level in the control (n = 8) and the HS (n = 9) groups (i). The haptoglobin/GAPDH mRNA ratio in the liver in the control (n = 8) and the HS (n = 5) groups (j). Statistical analysis was performed using unpaired Student’s t test in (b), (d), (f), (i), and (j). The associations between two parameters were analyzed using Pearson’s correlation coefficient in (c), (e), (g) and (h) by JMP Pro Version 14.2.0 software (SAS Institute Inc.). *p < 0.05 vs. the control group.

