Figure 6.
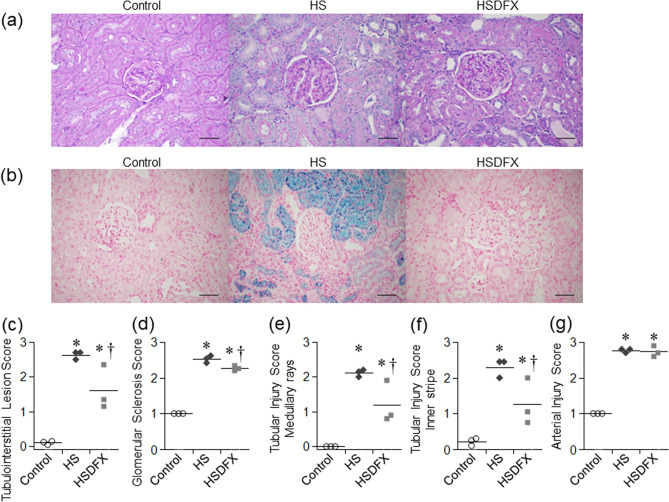
Histological analysis of kidney in Dahl/SS rats. (a) Representative PAS staining of the renal cortex in the control, the HS and the HSDFX groups (bars 100 μm). (b) Representative Berlin blue staining of the renal cortex in the control, the HS and the HSDFX groups (bars 100 μm). As histological analysis of kidney, tubulointerstitial lesion score (c), glomerular sclerosis score (d), tubular injury score in the medullary rays (e) and the inner stripe (f), and arterial injury score (g) are shown. Statistical analysis was performed using one-way analysis of variance followed by Tukey–Kramer test in (c), (d), (e), (f), and (g) by JMP Pro Version 14.2.0 software (SAS Institute Inc.). *p < 0.05 vs. the control group, †p < 0.05 vs. the HS group.

