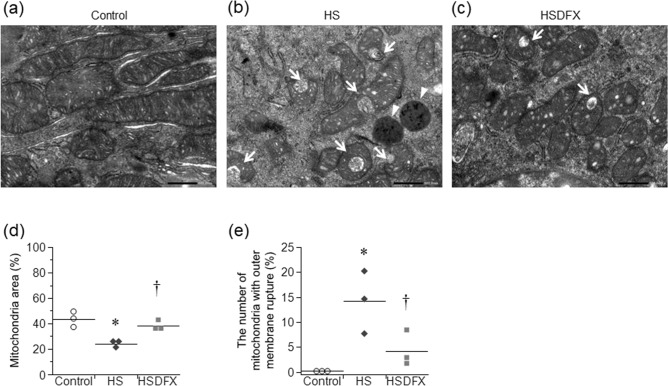
Figure 7.
Mitochondrial damage in the renal proximal tubular epithelial cells. The electron micrographs show the mitochondria in the renal proximal tubular epithelial cells in the control group (a), the HS group (b), and the HSDFX group (c) (bars 500 nm). Panel (d) shows the percentage of mitochondria area in cytoplasm. Panel (e) shows the percentage of mitochondria with outer membrane rupture in the total number of mitochondria. (n = 3 for each group, Arrow: outer mitochondrial membrane rupture, Arrowhead: lysosome). Statistical analysis was performed using one-way analysis of variance followed by Tukey–Kramer test in (d) and (e) by JMP Pro Version 14.2.0 software (SAS Institute Inc.). *p < 0.05 vs. the control group, †p < 0.05 vs. the HS group.

