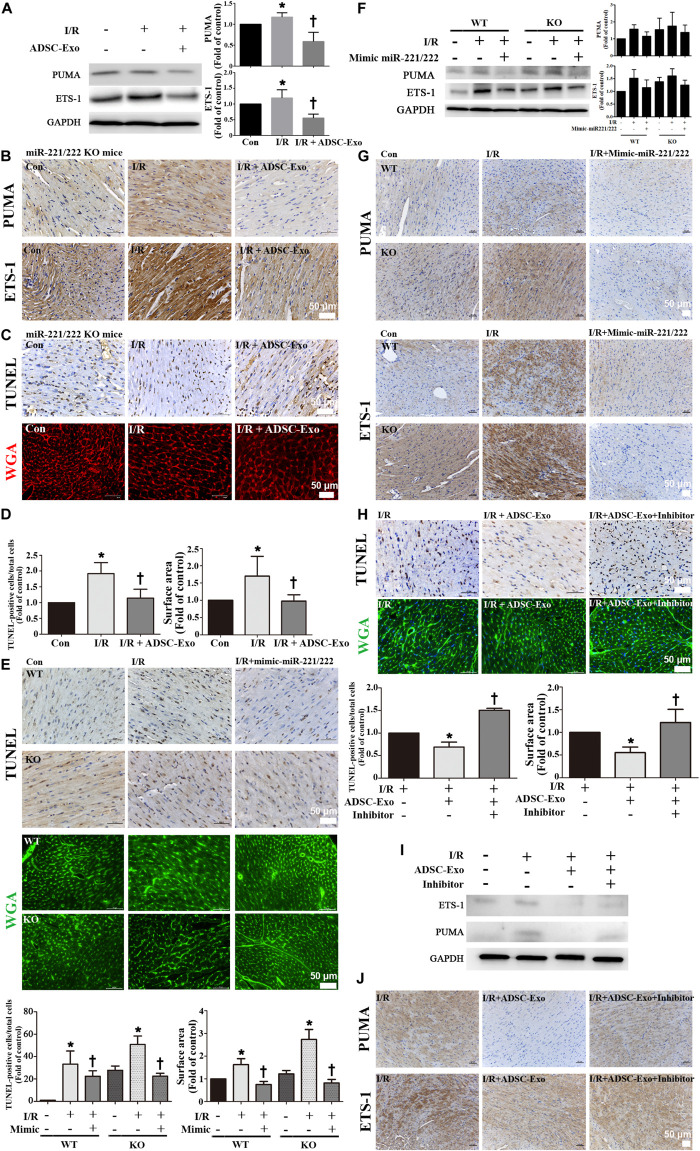
FIGURE 6.
ADSC-Exo has protective effects on myocardial I/R injury in miR-221/222 KO mice. miR-221/222 KO mice were subjected to ischemia for 30 min followed by reperfusion for 3 h. In the I/R + ADSC-Exo-treated miR-221/222 KO mouse model, 25 min after occlusion, ADSC-Exo (100 μg protein in 50 μL), miR-221/222 mimics or inhibitors (50 pmole in 50 μL) were injected uniformly intramuscularly into the border zone of the anterior wall of the left ventricle at five positions, followed by reperfusion for 3 h. (A) The levels of PUMA and ETS-1 protein were evaluated by Western blot analysis. (B) The effects of ADSC-Exo on PUMA and ETS-1 expression in miR-221/222 KO mice. (C,D) The effects of ADSC-Exo on apoptosis and hypertrophy were examined by TUNEL assay and WGA staining, respectively, in miR-221/222 KO mice. The results from the quantitative analysis of TUNEL-positive cells or cell surface area are shown. (E) The effects of the transfection of miR-221/222 mimics on apoptosis and hypertrophy were examined by TUNEL assay and WGA staining, respectively, in WT and miR-221/222 KO mice. Quantitative analysis of TUNEL-positive cells or cell surface area is shown. (F,G) The effects of the transfection of miR-221/222 mimics on the expression of PUMA and ETS-1 were examined by Western blot analysis and by immunohistochemistry in WT and miRNA-221/222 KO mice. (H) The effects of the transfection of miR-221/222 inhibitors on apoptosis and hypertrophy were examined by TUNEL assay and WGA staining, respectively, in WT mice. The results of the quantitative analysis of TUNEL-positive cells and cell surface area are shown. (I,J) The effects of the transfection of miR-221/222 inhibitors on the expression of PUMA and ETS-1 were examined by Western blot and by immunohistochemistry in WT mice. Data are expressed as the mean ± SD (n = 3). Brown color: apoptotic cells; blue color: nuclei. Red or green color: cell boundary. *P < 0.05 vs. the control group; †P < 0.05 vs. I/R group. Scale bar, 50 μm.

