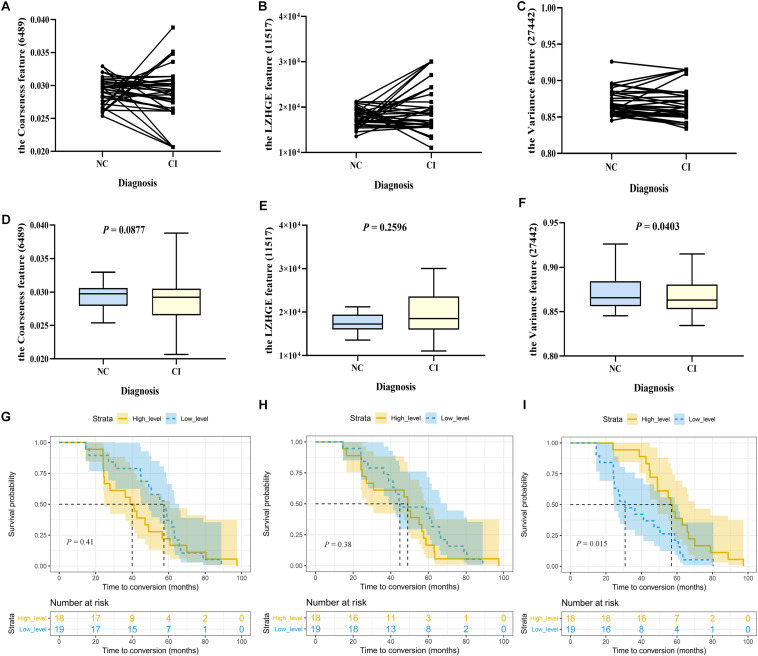
FIGURE 3.
The longitudinal changes and survival analyses of stable high-frequency features. In Study 2, 37 participants were included. Their cognition was normal at baseline and impaired during follow-up, with two progressing to dementia and 35 to mild cognitive impairment. We compared the levels of each stable high-frequency feature between the two time points. (A–C) Show the changing trajectory at the individual level; (D–F) are at the group level, with paired two-sample t-tests (two-tailed, p < 0.05). Furthermore, these individuals were stratified into high-level (n = 18) and low-level group (n = 19) groups by the baseline median level of each stable high-frequency feature. (G–I) Show Kaplan–Meier curves demonstrating the cumulative probabilities of conversion of the two groups (shaded area represents the 95% confidence interval); differences are displayed by log-rank tests (p < 0.05). Only feature 27,442 was different at the two time points (p = 0.0403), and its low-level group had a shorter conversion time than the high-level group (p = 0.015). The features were the coarseness feature of the left posterior cingulate gyrus on sMRI (ID: 6489; A, D, G), the LZHGE feature of the right posterior cingulate gyrus on sMRI (ID: 11517; B, E, H), and the variance feature of the left superior parietal gyrus on sMRI (ID: 27442; C, F, I). NC, normal control; CI, cognitive impairment; sMRI, structural magnetic resonance imaging; LZHGE, large zone high-gray-level emphasis.

