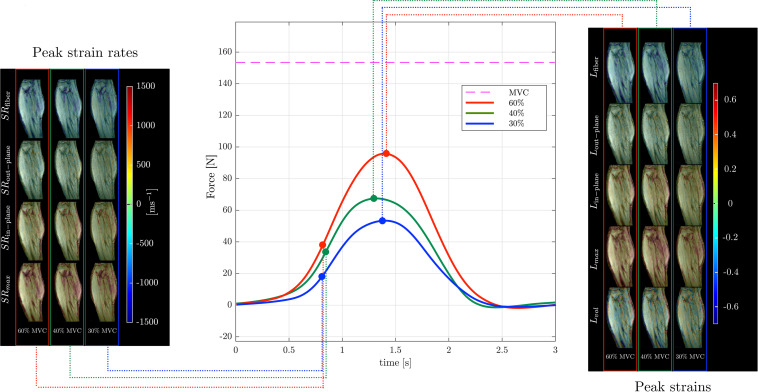
FIGURE 4.
Temporal variation of forces exerted by a senior subject averaged during the MR data acquisition for different force levels (center panel) along with corresponding strain (right panel) and strain rate (left panel) colormaps at the peak values (of Lfiber or SRfiber) during the contraction phase of the dynamic cycle for 60% (left column), 40% (middle column), and 30% MVC (right column). The colormap bars are shown in each panel. The temporal frames at which the peaks during contraction occurred for strain and strain rate are marked on the force curves. While the peak in strains occur at the maximum force reached, peak in strain rates occur earlier and roughly correspond to the maximum slope of the force-time curve in the contraction cycle. The subscripts, fiber, out–plane, in–plane and max, vol for SR and L are explained in the text. Colormaps of the strain and strain rate indices for the entire MR acquisition cycle are presented in Supplementary Figure S4.

