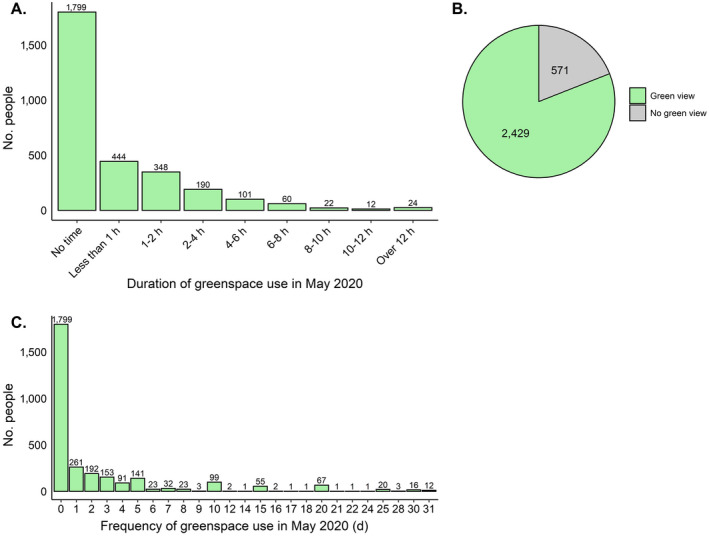
Fig. 2.

Frequencies of answers given to the questions asked to assess participants’ levels of nature experiences (A, duration of greenspace use; B, green view through windows from home; C, frequency of greenspace use). Numbers above the bars in panels A and C and in pie chart in panel B represent the numbers of people who answered the questions in that way.
