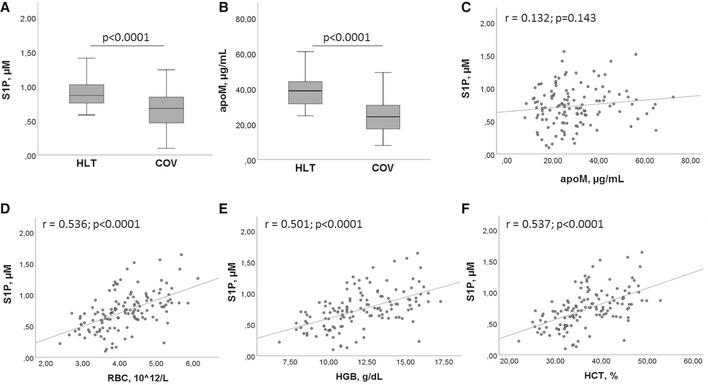
Figure 1. Serum levels of S1P and apoM in HLT and COV patients.

-
A, BSerum levels of S1P (A) and apoM (B) in HLT (n = 47) and COV (n = 111) patients. The box plots represent the interquartile range with median value (central line); the whiskers represent the measured range of HLT and COV. Each measurement was run in triplicate, and performed at least twice. Two‐tailed Student’s t‐test was used for statistical analysis. P < 0.0001 is reported.
-
C–FPearson correlation between S1P and apoM (C), RBC number (D), HGB concentration (E), HCT value (F). Scatter plots, together with the fitted regression line, are shown. Pearson correlation was performed for statistical analysis. Exact P values or P < 0.0001 are reported.
