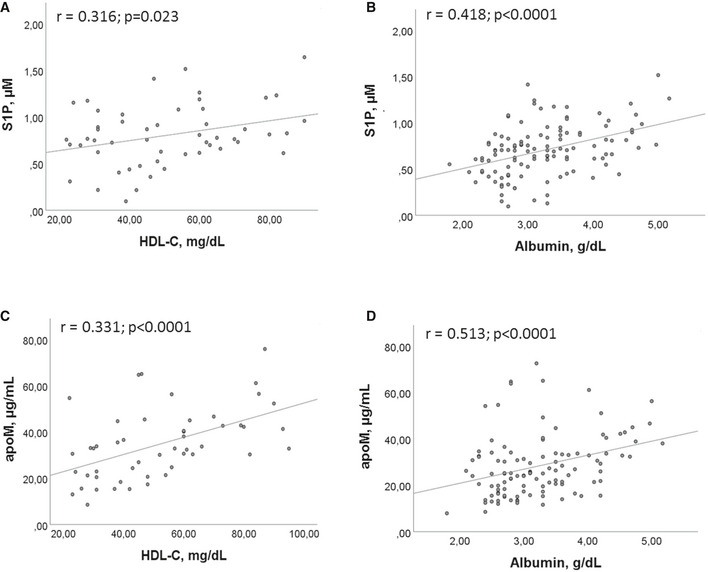
Figure 2. Correlations between S1P/apoM and their transporters.

-
A, BCorrelations between S1P and HDL‐C (A), and albumin (B).
-
C, DCorrelations between apoM and HDL‐C (C) and albumin (D).
Data information: Scatter plots and fitted regression line are shown in each figure. Each S1P and apoM measurement was run in triplicate, and performed at least twice in independent assays. Pearson correlation was performed for statistical analysis. Exact P values or P < 0.0001 are reported.
