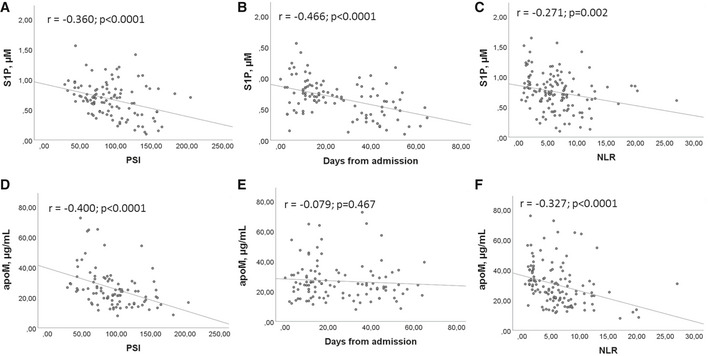
Figure 4. Correlation between S1P/apoM and COVID‐19 infection severity.

-
A–FPearson correlation between S1P (A–C) or apoM (D–F) and PSI (A, D), days from admission (B, E), and NLR (C, F) in COV (n = 111). Scatter plots and fitted regression line are shown in each figure. Exact P values or P < 0.0001 are reported.
