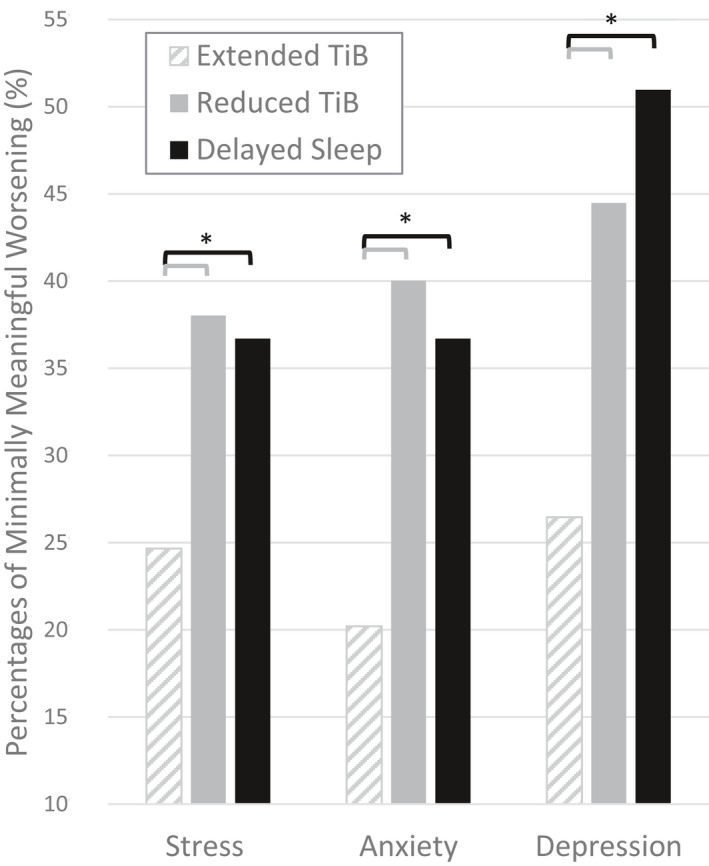
FIGURE 5.

Proportions of respondents with minimally meaningful worsening of symptoms of stress, anxiety and depression from pre‐outbreak to during the outbreak in each subgroup with distinct sleep behaviour profiles. TiB: time in bed; Stress: Perceived Stress Scale; Anxiety: Generalized Anxiety Disorder 7; Depression: Quick Inventory of Depressive Symptomatology recalculated without the items pertaining to sleep (*p < .001, V > 0.11)
