
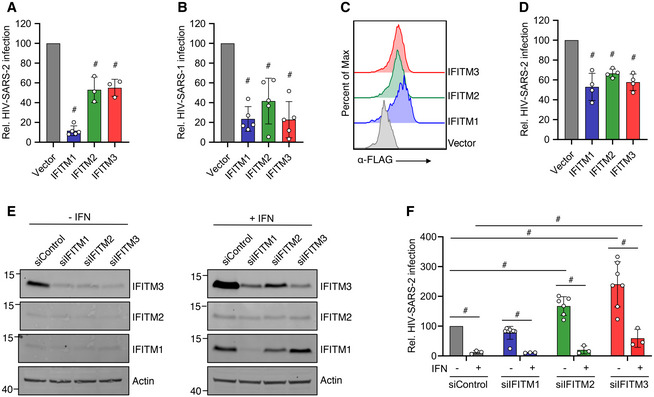
Figure 1. Human IFITMs inhibit SARS‐CoV‐2 Spike‐pseudotyped lentivirus infections.
-
A, BHEK293T cells transduced with the indicated FLAG‐tagged IFITM expression constructs or vector control plus transient transfection of ACE2 were infected with HIV‐1 expressing a luciferase reporter gene pseudotyped with (A) SARS‐CoV‐2 Spike (HIV‐SARS‐2) or (B) SARS‐CoV Spike (HIV‐SARS‐1). Measurement of luciferase activity 72 h post‐infection served as a readout for infection. Luciferase readings were normalized to vector control, which was set to a value of 100. Bars in (A) and (B) represent averages with individual data points from 3 to 5 independent experiments shown as circles. Error bars represent SD. # P < 0.05 compared to vector control by ANOVA followed by Tukey’s multiple comparisons test. Not indicated in (A), IFITM1 was also significantly different from IFITM2 and IFITM3.
-
CRepresentative example flow cytometry plots from cells transfected as in (A) and (B) demonstrate high transfection efficiency and expression of each of the FLAG‐tagged IFITMs.
-
DCaco‐2 cells were transfected as in (A) and (B) and infected with HIV‐SARS‐2. Luciferase readings at 72 h post‐infection were normalized to vector control, which was set to a value of 100. Bars represent averages with individual data points from 4 independent experiments shown as circles. Error bars represent SD. # P < 0.05 compared to vector control by ANOVA followed by Tukey’s multiple comparisons test.
-
ECaco‐2 cells were transfected with the indicated siRNAs for 48 h followed by treatment with IFNβ for 24 h. Western blotting of cell lysates is shown.
-
FCells as in (E) were infected with HIV‐SARS‐2. Luciferase readings at 48 h post‐infection were normalized to vector control, which was set to a value of 100. Bars represent averages with individual data points from 3 to 7 independent experiments shown as circles. Error bars represent SD. # P < 0.05 by ANOVA followed by Tukey’s multiple comparisons test for the comparisons indicated by lines.
Source data are available online for this figure.