
Figure 4. Mouse IFITMs inhibit SARS‐CoV‐2 infection.
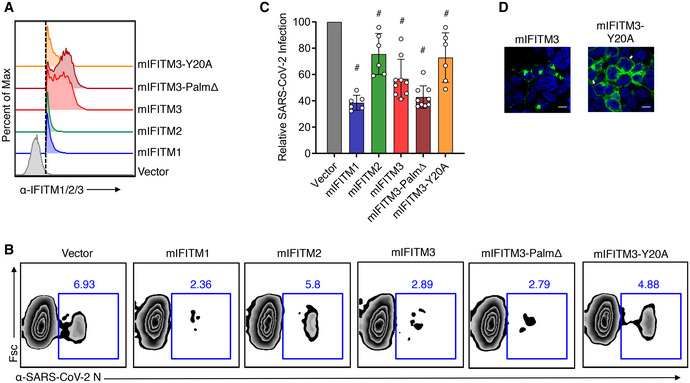
HEK293T‐ACE2‐GFP stable cells were transiently transfected with mouse (m) IFITM plasmids or vector control for 24 h.
- Flow cytometry histograms showing expression of each of the IFITM constructs with the dotted line indicating gating that was used for examining percent infections in IFITM‐expressing cells.
- Transfected HEK293T‐ACE2‐GFP cells were infected with SARS‐CoV‐2 (MOI 1) for 24 h and analyzed for percent infection by flow cytometry. Representative example plots are shown for each transfection condition.
- Graph depicts normalized infection percentage measurements from 2 to 3 independent experiments, each performed in triplicate, from cells infected as in (B). Bars represent averages with individual data points shown as circles. Error bars represent SD. # P < 0.05 compared to vector control by ANOVA followed by Tukey’s multiple comparisons test.
- Confocal microscopy of HEK293T cells transfected with WT mIFITM3 or mIFITM3‐Y20A. Green, anti‐IFITM3; blue, DAPI. White arrows highlight plasma membrane localization of IFITM3‐Y20A. Scale bars represent 10 µm.
Source data are available online for this figure.