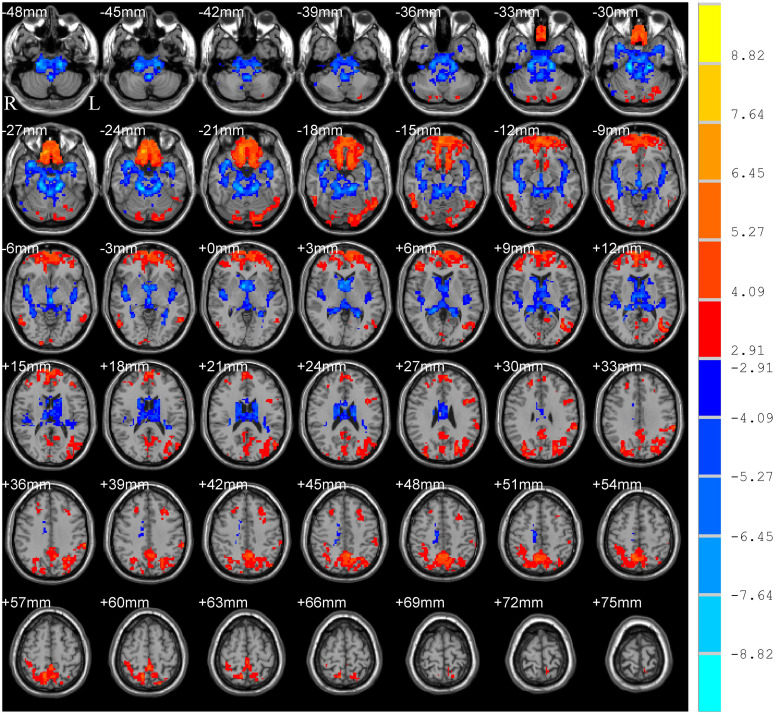
FIGURE 3.
Main effect of frequency band on ALFF. The results were obtained by two-way repeated-measures ANOVA [GRF corrected, voxel p < 0.005, cluster p < 0.05, threshold of t > 2.91, and cluster size >39 voxels (1,053 mm3)]. The color bar on the right indicates statistical t-value. Warm (cold) overlays indicate higher (lower) ALFF in slow-5 band than in slow-4. L/R, left/right.

