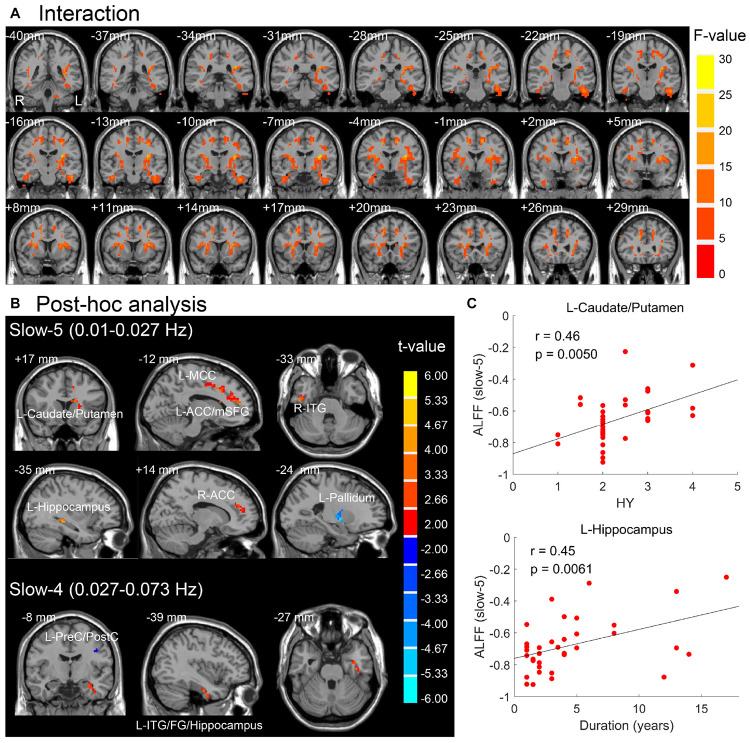
FIGURE 4.
(A) Interaction effect between group and frequency band (p < 0.05, F > 3.98, uncorrected). (B) Post hoc two-sample t-test for slow-5 and slow-4 (voxel p < 0.05, threshold of t > 2.00, uncorrected). Warm (cold) overlays indicate higher (lower) ALFF in PD than in HC. (C) Significant correlations between mean ALFF of brain regions in panel (B) and clinical assessments (FDR corrected, p < 0.05). L/R, left/right; ACC/MCC, anterior/middle cingulate cortex; mSFG, medial superior frontal gyrus; ITG, inferior temporal gyrus; FG, fusiform gyrus; PreC/PostC, precentral/postcentral gyrus; HY, Hoehn and Yahr scale.

