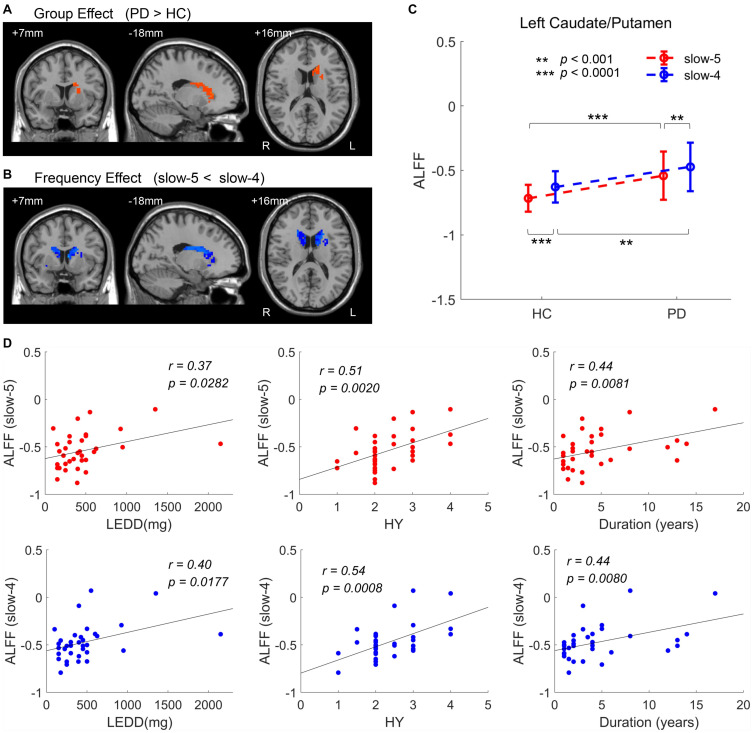
FIGURE 5.
ANOVA within the bilateral caudate/putamen. (A) Group effect [GRF corrected, voxel p < 0.05, cluster p < 0.05, threshold of t > 2.00, and cluster size >69 voxels (1,863 mm3)]. (B) Frequency effect [GRF corrected, voxel p < 0.05, cluster p < 0.05, threshold of t > 2.00, and cluster size >50 voxels (1,350 mm3)]. (C) ALFF of two groups within the significant region of group effect, the left caudate/putamen. (D) Clinical correlations within the significant region of group effect (the left caudate/putamen) (FDR corrected, p < 0.05). L/R, left/right; LEDD, levodopa equivalent daily dose; HY, Hoehn and Yahr scale. **p < 0.001, ***p < 0.0001.

