
FIGURE 4.
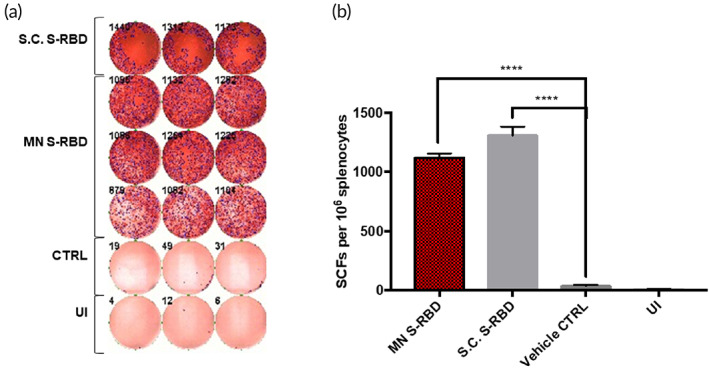
Interferon‐gamma (IFN‐γ) T‐cell responses: (a) IFN‐γ ELISPOT plate counts for S.C. S‐receptor‐binding domain (RBD) stimulated, microneedle (MN) S‐RBD stimulated, blank MN stimulated (CTRL) and un‐induced (UI) groups. (b) Bar chart shows mean IFN‐γ ELISPOT counts for all four groups. Student's unpaired parametric t‐test was used with Welch's correction. Data were expressed as mean ± SD. *p < 0.05, **p < 0.01, ***p < 0.001, ****p < 0.0001, ns refers to “not significant”