
Figure 2.
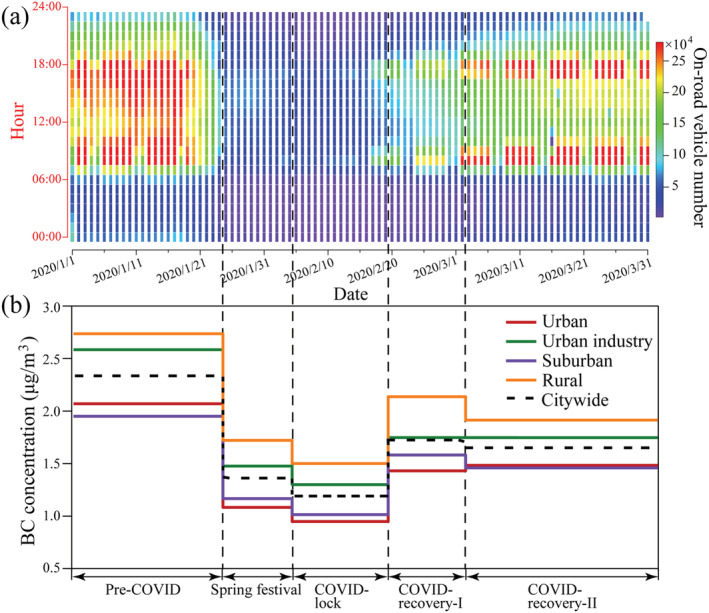
(a) The hourly averaged vehicle number running on the roads showing the variation in traffic in downtown Hangzhou. Data source: Hangzhou Traffic Police Division. The figure was generated using Igor Probased computer programs developed by (Wu et al. (2018)). (b) The mean deweathered BC concentration in different areas during the five stages. The detailed BC concentration is presented in Table S3 in the supporting information.