Figure 3.

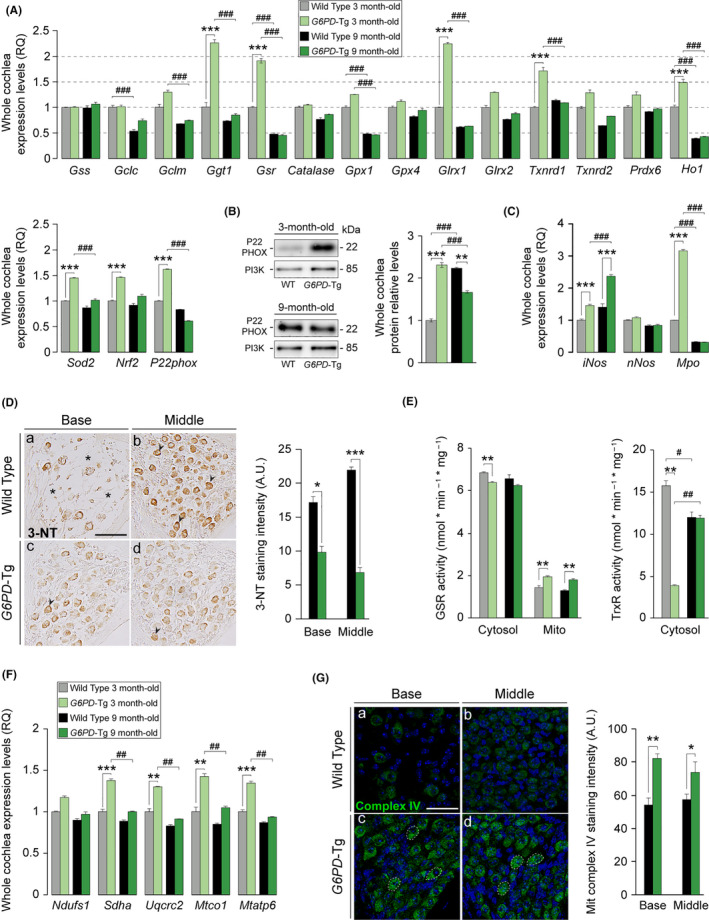
Nine‐month‐old G6PD‐Tg mice have reduced oxidative stress, cochlear oxidative damage, and mitochondrial dysfunction. (A) RT‐qPCR gene expression levels of redox enzymes from whole cochleae pooled samples from three 3‐ and 9‐month‐old mice per condition. Expression levels were calculated as 2−ΔΔCt (RQ), using 18s as a reference gene and normalized to data from 3‐month‐old WT mice. (B) Western blotting of whole cochlear protein extracts, P22PHOX levels were referred to those of PI3K and normalized to data from 3‐month‐old WT mice. Data presented as mean ± SEM of duplicate samples of pooled samples of three 3‐ and 9‐month‐old mice per condition. (C) RT‐qPCR gene expression levels of nitric oxide synthase isoforms and myeloperoxidase from whole cochleae pooled samples from three 3‐ and 9‐month‐old mice per condition. Expression levels were calculated as 2−ΔΔCt (RQ), using 18s as a reference gene and normalized to data from 3‐month‐old WT mice. Data presented as mean ± SEM of triplicate measurements. Statistical significance between genotypes and stages was analyzed by Student's t test: *G6PD‐Tg vs WT, # 9‐month‐old mice vs 3‐month‐old mice (*, #p < 0.05; **, ##p < 0.01; ***, ###p < 0.001). (D) Representative microphotographs of 3‐nitrotyrosine labeling of basal and middle turns of 9‐month‐old G6PD‐Tg and WT mice. Asterisks indicate absence of neurons, and arrowheads indicate presence of positive staining. Scale bar: 50 µm. Staining intensity in spiral ganglion (SG) neurons from mice; at least 3 different microphotographs per turn were evaluated (n = 3 mice per experimental group). Values presented as mean ± SEM. (E) GSR and TrxR activity in cytosolic and mitochondrial (only GSR) fractions measured from pooled samples of three cochleae from three 3‐ and 9‐month‐old mice per condition. Values presented relative to milligram of protein. Data presented as mean ± SEM of at least duplicate measurements. Statistical significance between genotypes and stages was analyzed by Student's t test: *G6PD‐Tg vs WT, # 9‐month‐old mice vs 3‐month‐old mice (*, #p < 0.05; **, ##p < 0.01; ***, ###p < 0.001). (F) RT‐qPCR gene expression levels of mitochondrial complexes components from whole cochleae pooled samples from three 3‐ and 9‐month‐old mice per condition. Expression levels were calculated as 2−ΔΔCt (RQ), using 18s as a reference gene and normalized to data from 3‐month‐old WT mice. Data presented as mean ± SEM of triplicate measurements. Statistical significance between genotypes and stages was analyzed by Student's t test: *G6PD‐Tg vs WT, # 9‐month‐old mice vs 3‐month‐old mice (*, #p < 0.05; **, ##p < 0.01; ***, ###p < 0.001). (G) Mitochondrial complex IV staining intensity of positive stained area of the SG of 9‐month‐old mice. At least 3 different measurements per turn were taken (n = 4 WT, n = 3 G6PD‐Tg). Scale bar: 50 µm. Values are presented as mean ± SEM. Statistical significance between genotypes was analyzed by Student's t test (*p < 0.05; **p < 0.01; ***p < 0.001)
