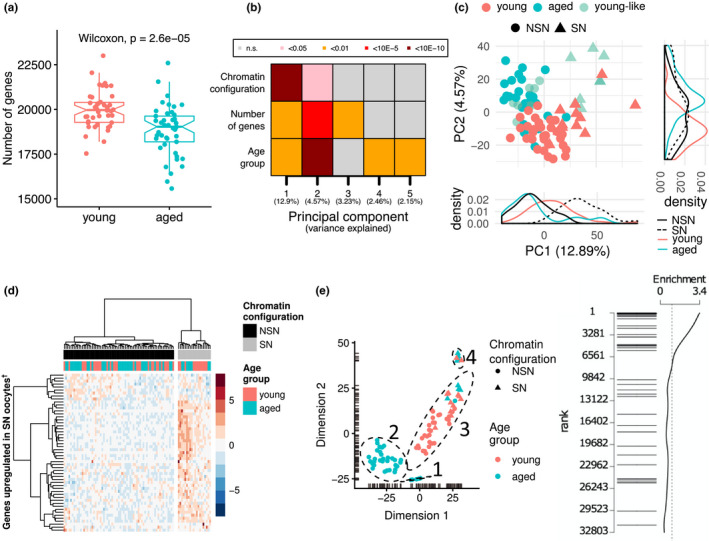
Figure 1.

Transcriptomic profiles of oocytes from young and old females. (a) Boxplots of transcript diversity showing a decrease in oocytes from aged mice (Wilcoxon test;p = 2.6x10⁻⁵). Each dot represents the number of genes detected at ≥1 counts in scRNA‐seq of an individual MII oocyte. (b) Heatmap of the associations (linear regression) between a transcriptional signature of chromatin configuration, number of detected transcripts and age with the first five principal components of the transcriptome. (c) Principal component analysis (PCA) plot of the transcriptome of oocytes from young and aged mice. Principal component 1 (PC1) is highly explained by a predicted chromatin configuration (non‐surrounded nucleolus (NSN): circles; surrounded nucleolus (SN): triangles). PC2 is highly explained by age (young: red; aged:turquoise). A subpopulation of aged oocytes with young‐like (light turquoise) features is also demarcated. (d) Hierarchical clustering for the prediction of chromatin states of oocytes as NSN (black) or SN (grey) according to the level of expression of genes overexpressed in SN oocytes. (e) t‐SNE plot showing four main clusters of oocytes driven by inferred chromatin state and/or age group. (f) Barcode plot showing the enrichment of maternal effect genes when testing for differences across the four main clusters of oocytes. Each horizontal bar represents one maternal effect gene. The position of the bar along they‐axis represents its ranking across all expressed genes tested for differential expression (1 being the most significant)
