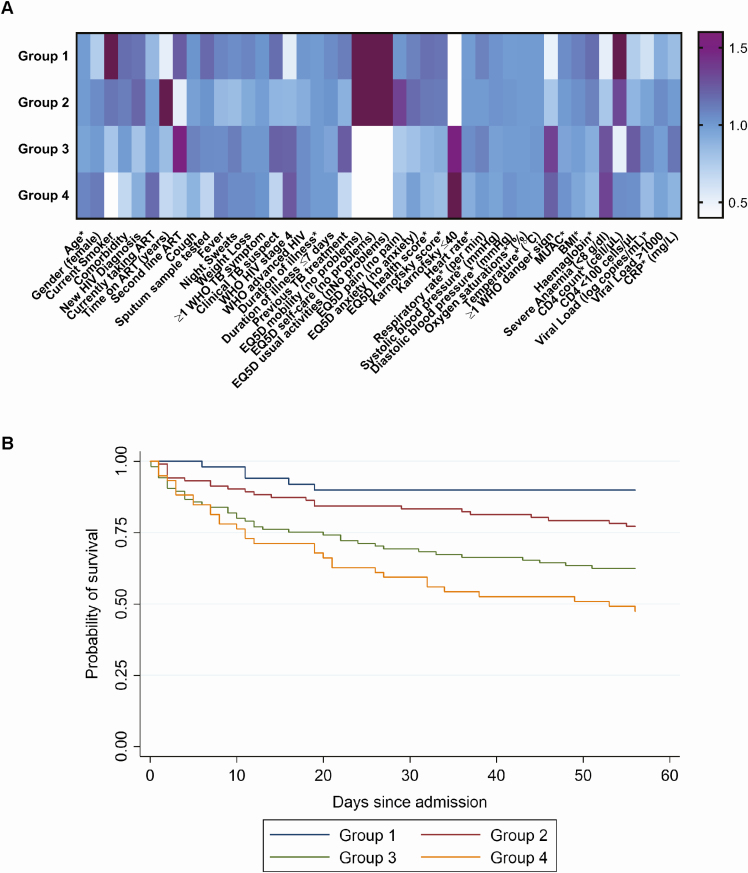
Figure 1.
Cluster analysis clinical phenotypes of patients with human immunodeficiency virus (HIV)/tuberculosis patients and their mortality risk. A, Heat map comparing characteristics of clinical phenotype groups (from cluster analysis) to the overall population. Overall, n = 317; group 1, n = 51; group 2, n = 102; group 3, n = 105; group 4, n = 59. For continuous variables (marked with *), colors represent a ratio of mean or median values for the group compared to the overall mean or median. For categorical variables, the ratio is the group proportion compared to the overall proportion. Dark purple represents a ratio >1.6, and white represents a ratio <0.4. Missing data: 1 missing hemoglobin, 2 missing second-line antiretroviral therapy (ART) regimen, 93 missing C-reactive protein, 222 missing HIV viral load. EurQol 5 dimension variables are the proportion reporting “no problem.” Time on ART and second-line ART are restricted to patients reporting current ART use. B, Kaplan-Meier plot of time to death by clinical phenotype group. Hazard ratio compared to group 1 is 2.4 (95% confidence interval [CI], .9–6.3) for group 2; 4.5 (95% CI, 1.8–11.4) for group 3; and 6.7 (95% CI, 2.6–17.3) for group 4 (P < .001). Abbreviations: ART, antiretroviral therapy; BMI, body mass index; CRP, C-reactive protein; EQ5D, EurQol 5 dimension; HIV, human immunodeficiency virus; MUAC, mid-upper arm circumference; TB, tuberculosis; WHO, World Health Organization.

