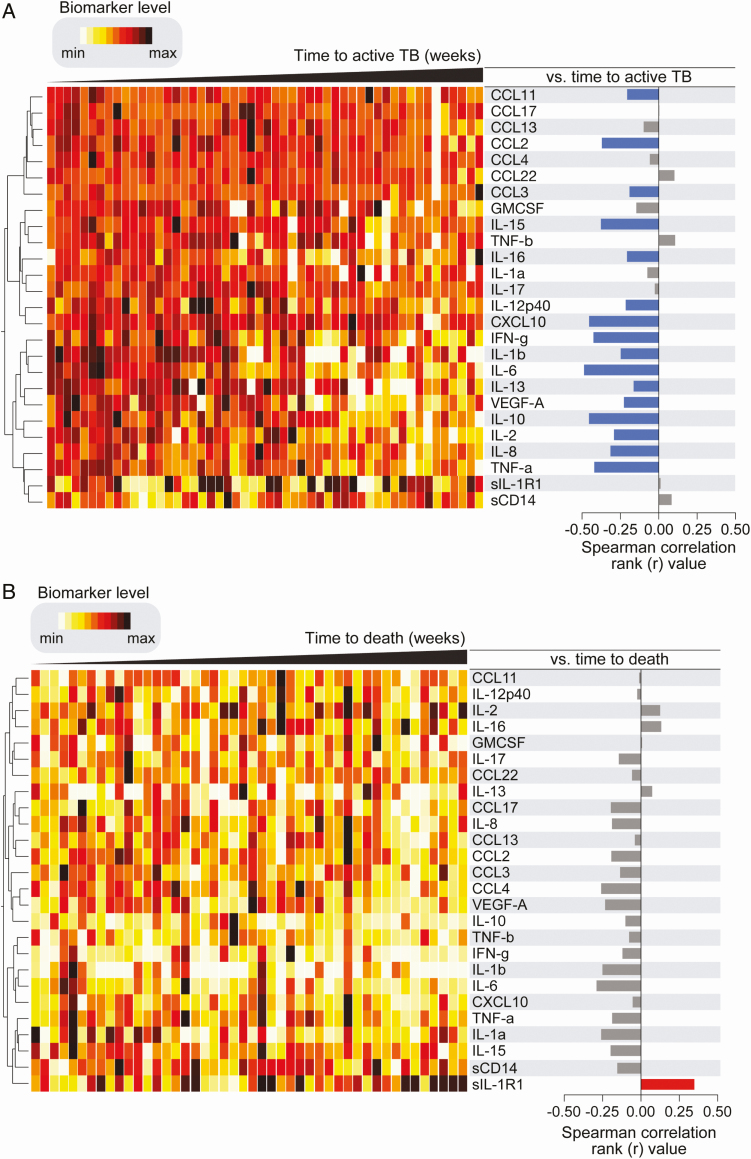
Figure 4.
A. Associations between baseline plasma inflammatory biomarkers and time to TB diagnosis. Left: Data were log-transformed and ranked and colored in a heatmap from minimum to maximum values detected for each marker. Patients were ordered based on time to TB diagnosis (in weeks) and plasma biomarkers were clustered (Ward’s method with 100× bootstrap) according to the distribution profile in the study population. Dendrograms represent Euclidean distance. Right: Spearman correlations for each marker and time to TB diagnosis. Blue bars indicate statistically significant correlations after corrections for multiple measurements (Holm-Bonferroni’s method). Abbreviation: TB, tuberculosis. B. Associations between baseline plasma inflammatory biomarkers and time to death. Left: Data were log-transformed and ranked and colored in a heatmap from minimum to maximum values detected for each marker. Patients were ordered based on time to death (in weeks) and plasma biomarkers were clustered (Ward’s method with 100× bootstrap) according to the distribution profile in the study population. Dendrograms represent Euclidean distance. Right: Spearman correlations or each marker and time to death. Only soluble IL1-R1 remained statistically significant after corrections for multiple measurements (Holm-Bonferroni’s method). Only participants with valid values for all markers were included (n = 46). Abbreviation: IL1-R1, interleukin 1 receptor, type 1 min, minimum; max, maximum.

