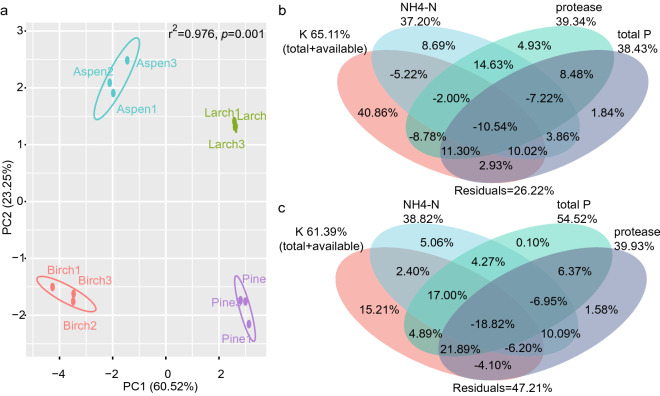
Figure 3.
Soil properties. Facet a visualized the PCA results. Fiducial limit for confidence ellipses in this PCA visualization was 0.95. The r2 and p values at the top right corner are PERMANOVA results. Facets b and c were visualizations of variance partitioning analysis (VPA). Soil properties that highlighted in RDA/CCA analysis were employed to performed VPA with soil fungal (b) and bacterial (c) communities of these four southern boreal forests respectively.

