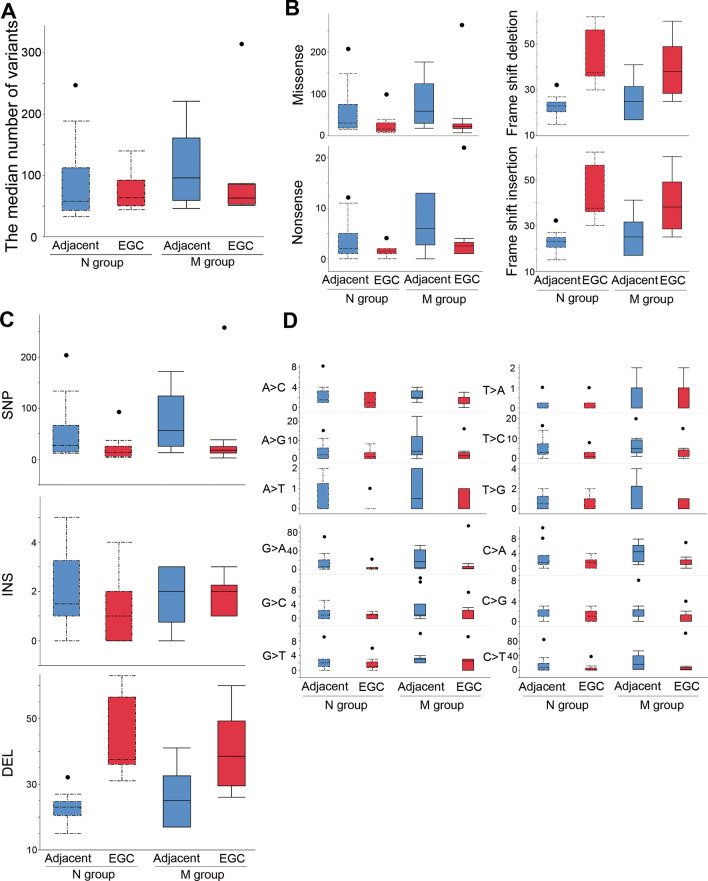
Figure 3.
Comparison of somatic variants between the N and M groups. The median numbers of somatic variants were 58.0 (IQR, 42.7–112.5) in the adjacent non-cancerous mucosa of the N group, 63.5 (IQR, 50.2–92.5) in the initial EGC of the N group, 96.0 (IQR, 59.5–161.2) in the adjacent non-cancerous mucosa of the M group, and 63.0 (IQR, 53.2–85.5) in the initial EGC of the M group (p = 0.36, A). The classification (B) or type (C) of variants and SNP classes (D) were not significantly different between the groups. Box plot: the bottom and top of each box represent the 25th and 75th percentiles, respectively, and the band in the box is the median. Whiskers: the lowest datum is within the minimum, and the highest datum is still within the 1.5 IQR of the upper quartile. Values of outliers are drawn as dots. We used the Kruskal–Wallis test, with post hoc Steel–Dwass test, to evaluate the statistical differences between groups. Actual values are provided in Suppl. Table 3. SNP single nucleotide polymorphism, INS insertion, DEL deletion.

