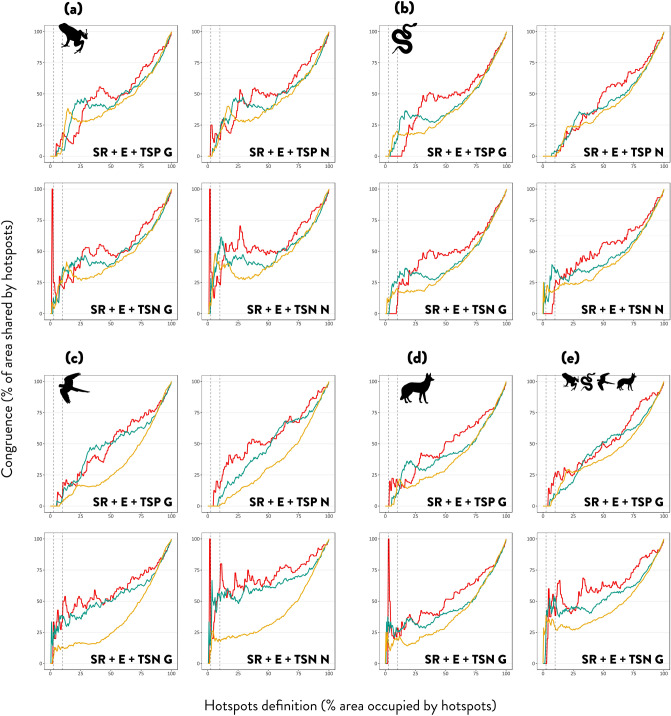
Figure 2.
Extent of spatial congruence across types of hotspots. Species-richness (SR), endemism (E), threatened species proportion using the global IUCN assessment (TSP G) or national IUCN assessment (TSP N), and threatened species number using the global IUCN assessment (TSN G) or national IUCN assessment (TSN N). For amphibians (a), reptiles (b), birds (c), mammals (d) and tetrapods (e). Metrics are analysed with three different grid-cell sizes 50 × 50 km (red line), 25 × 25 km (green line) and 12.5 × 12.5 km (yellow line). Congruence is the number of cells that represent hotspots for all three diversity indices and is measured as the percentage of shared grid-cells over the percentage of land covered by hotspots according to a varying definition from 0 to 100% of the total grid-cells. Vertical dashed lines show 2.5% and 10% hotspot definition criterion.

