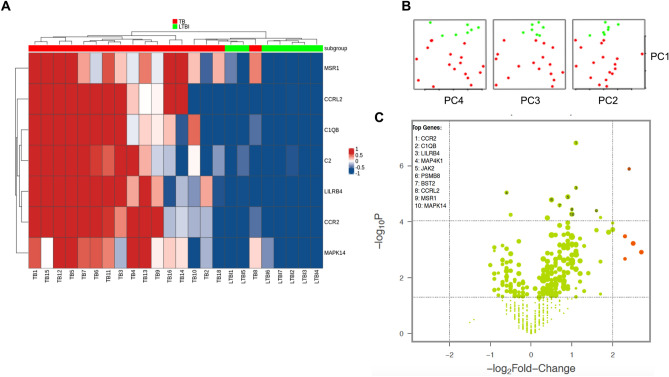
Figure 3.
Identification of markers for TB progression. (A) Heatmap of seven gene expression levels of TB (red) and LTBI (green) subjects. (B) PCA score plot of TB and LTBI subjects. (C) Volcano plot showing the distribution of the gene expression fold changes in TB patients relative to LTBI. Genes with absolute fold change ≥ 4 and p-value ≤ 0.05 are indicated in orange. Expression levels are scaled from dark blue (low expression) to dark red (high expression). Figures were generated with R (version 3.6.3) using ComplexHeatmap package (version 2.0.0, https://bioconductor.org/packages/release/bioc/html/ComplexHeatmap.html), prcomp function from stats package (version 3.6.3, https://www.r-project.org/), and NanoStringNorm package (version 1.2.1.1, https://cran.r-project.org/web/packages/NanoStringNorm/index.html) for heatmap, pca and Volcano plot, respectively.

