FIGURE 7.

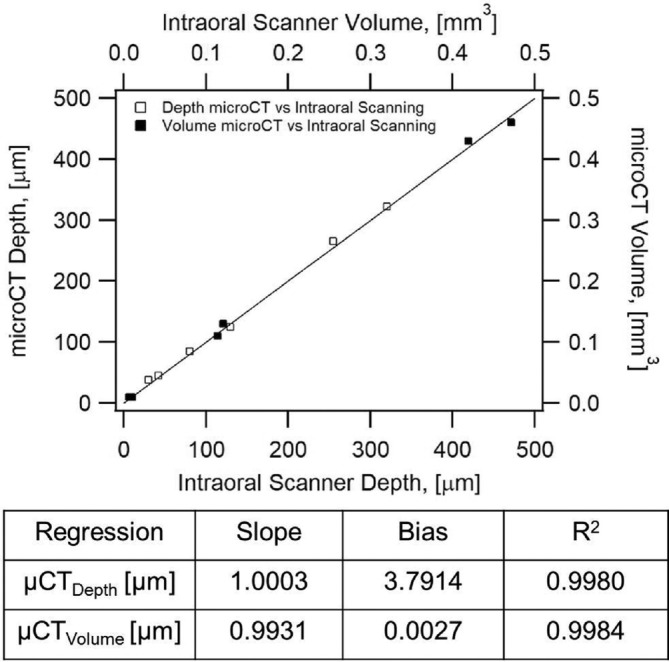
Regression analysis showing intraoral Parity plot for depth (open squares) and volume (closed squares) of worn areas obtained from micro‐CT and intraoral scanning. Agreement for depth is 99.8% and 99.84 for volume

Regression analysis showing intraoral Parity plot for depth (open squares) and volume (closed squares) of worn areas obtained from micro‐CT and intraoral scanning. Agreement for depth is 99.8% and 99.84 for volume