FIGURE 7.

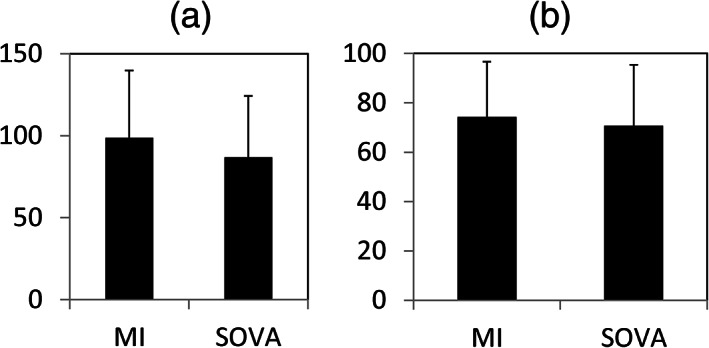
Compliance results plotted as total nights of splint wear (a), and as percent total days splint was in possession of subject (b). Histograms are means with 1 SD error bars for the MI versus SOVA groups

Compliance results plotted as total nights of splint wear (a), and as percent total days splint was in possession of subject (b). Histograms are means with 1 SD error bars for the MI versus SOVA groups