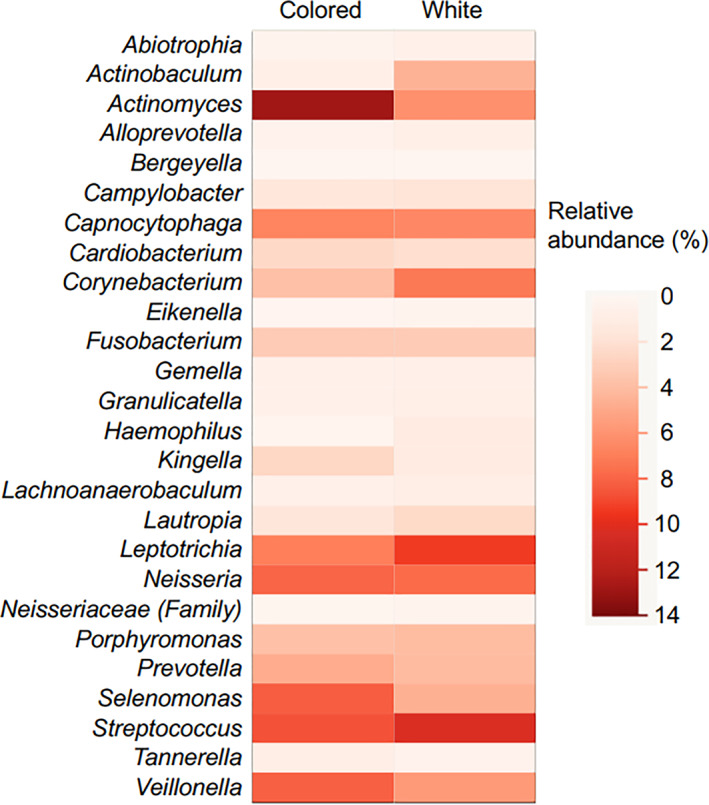
FIGURE 3.

Heat map showing relative abundance of each bacterial taxon in colored and white biofilms. The average detection rate for each bacterial taxon in all reads among colored and white biofilms is schematically shown. Twenty‐six bacterial taxa, defined as core microbiomes for this study, were extracted and are presented
