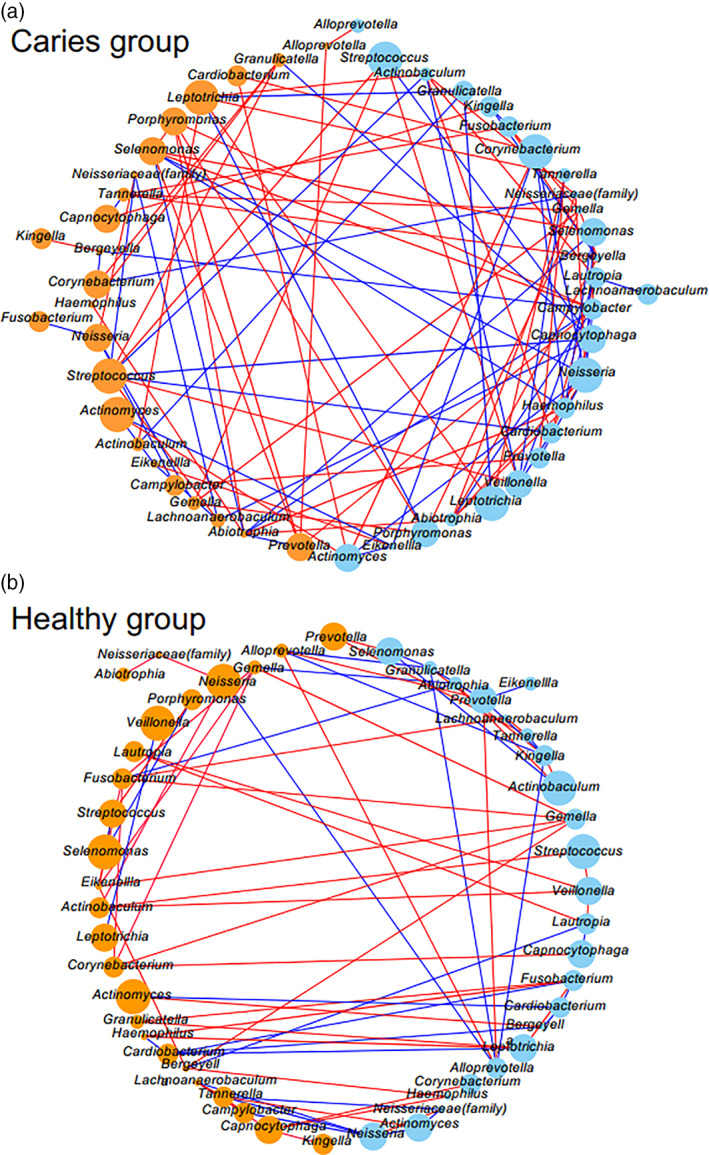
FIGURE 5.

Co‐occurrence networks. (a) Severe caries and (b) healthy groups. Among the 26 bacterial taxa examined, all combinations with a positive (red) or negative (blue) correlation in terms of relative abundance are shown by lines. Thin lines show SCC between two taxa greater than 0.4 and thick lines show those greater than 0.85. Circle represents each bacterial taxon, and its size and color reflects relative abundance and biofilm color, respectively. Colored biofilms are shown as orange and white as light blue
