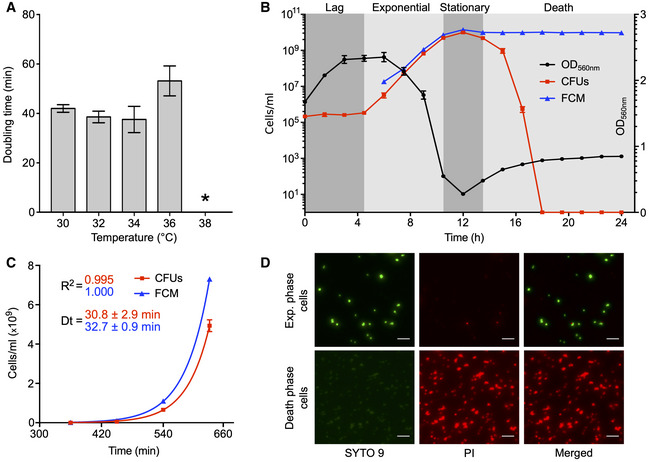
Figure 1. Analysis of M. florum growth in ATCC 1161 medium.

- M. florum doubling time at different incubation temperatures measured by colorimetric assays. The bars represent the mean and standard deviation values obtained from three technical replicates. The asterisk indicates the absence of significant growth, preventing the calculation of a doubling time.
- M. florum growth kinetics at 34°C. Growth was monitored for 24 h by measuring the optical density at 560 nm (black circles) as well as the cell concentrations using two different methods, colony‐forming units (CFUs, red squares) and flow cytometer (FCM, blue triangles). The four typical bacterial growth phases (lag, exponential, stationary, and death) are represented by gray shading. The dots and error bars indicate the mean and standard deviation values obtained from three independent biological replicates. CFU data points superimposed to the x‐axis represent values below the limit of detection (2 × 10⁻²).
- Exponential growth fit on CFU (red squares) and FCM (blue triangles) counts shown in B. Calculated doubling times (Dt) and correlation coefficients (R 2) are shown. The dots and error bars indicate the mean and standard deviation values obtained from three independent biological replicates.
- Representative images of SYTO 9 and propidium iodide (PI) double‐stained M. florum cells, harvested from an exponential or death‐phase culture, observed by widefield fluorescence microscopy. The brightness of each channel was adjusted equally between conditions. Scale bar: 5 µm.
