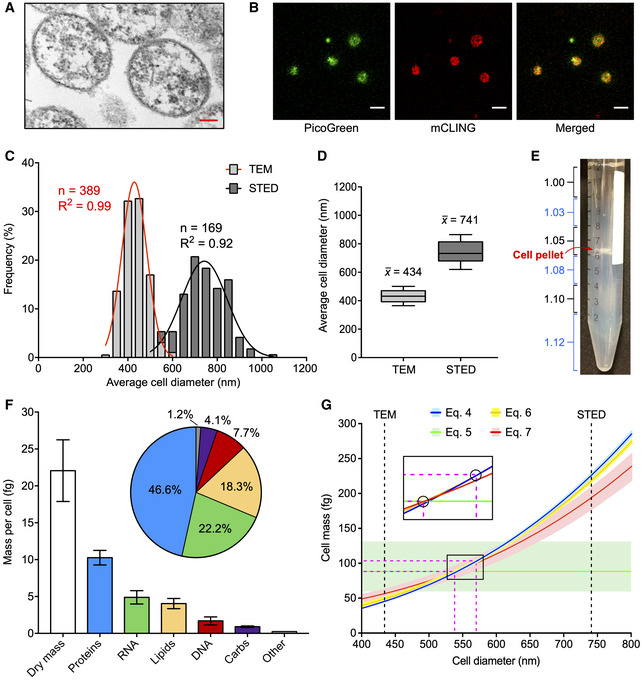
Figure 2. M. florum physical characteristics.

- Representative image of M. florum cells observed by transmission electronic microscopy (TEM). Scale: 100 nm.
- Representative image of PicoGreen (DNA) and mCLING (cellular membrane) double‐stained M. florum cells observed by stimulated emission depletion (STED) microscopy. Scale: 1 µm.
- Frequency distribution of M. florum average cell diameter measured by TEM and STED as shown in A and B, respectively. The average cell diameter was obtained by averaging the minor and major axis values measured for each cell. A Gaussian curve fit is indicated for each method, and the calculated correlation coefficients are shown. Bins: 50 nm.
- Boxplots showing the median and interquartile range of the average cell diameter calculated from 389 and 169 individual cells analyzed by TEM and STED, respectively. Whiskers indicate the 10–90 percentile range.
- Picture of M. florum cells analyzed by discontinuous density gradient centrifugation in Percoll. The approximative density of each Percoll layer is indicated (g/ml) and colored in blue if trypan blue was added to the layer. The position of the cell pellet is marked.
- M. florum biomass quantification. The mass of each macromolecular constituent is shown as well as its relative fraction in the quantified cellular dry mass. Bars represent the mean and standard deviation values obtained from three independent biological replicates (dry mass) or four technical replicates (proteins, RNA, lipids, DNA, carbs). The “Other” category bar represents the residual mass obtained by the subtraction of all quantified macromolecule masses from the total dry mass value.
- Graph showing the relation between the M. florum cell diameter (d) and its cell mass (CM) according to cell mass Equations (4), (5), (6), (7), (4.1), (4.2), (4.3) (see Materials and Methods). For each equation, the mean cell mass (CMmean) is indicated by a colored line, and the range of probable values (CMmin − CMmax) is shown by a light‐colored shading. The mean values of the average cell diameter measured by TEM and STED (see panel D) are indicated by black dashed lines. The portion of the graph where all the CMmean curves converge is enlarged and devoid of colored shadings for representation purposes. CMmean interception points encompassing all other interception points are encircled, and their corresponding x and y coordinates are indicated by fuchsia dashed lines (most probable cell diameter and most probable cell mass ranges).
