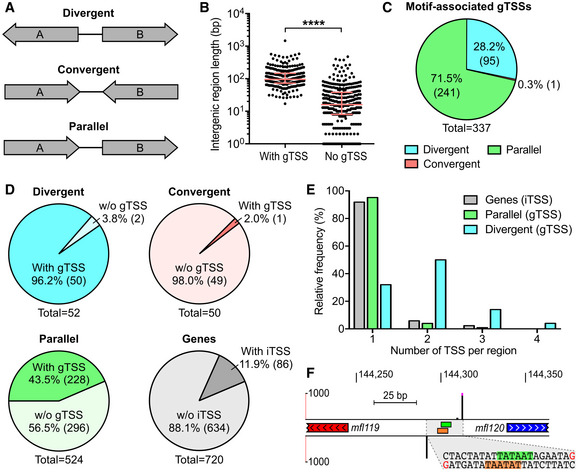
Figure EV3. Additional information concerning the genetic context of motif‐associated TSSs.

- Types of intergenic regions based on surrounding genes orientation.
- Length of intergenic regions with or without gTSS. The median and interquartile range are shown for each group. Distributions were compared using a Mann–Whitney test (two‐sided, ****P‐value < 0.0001).
- Total number of gTSSs for each of the three intergenic region groups depicted in A.
- Proportion of divergent, convergent, and parallel intergenic regions hit by at least one gTSS relative to their respective total number across the genome. The proportion of genes hit by iTSSs is also shown.
- Relative frequency distribution of the number of motif‐associated TSSs detected per gene, parallel intergenic region or divergent intergenic region.
- Genomic locus showing a representative case of two divergent genes expressed from two back‐to‐back overlapping promoters identified by 5′‐RACE. Genomic coordinates are indicated at the top of the panel. Strand‐specific 5′‐RACE signals are shown by black bars (0–1,000 read starts scale). Peaks above 1,000 read starts are cut and marked by fuchsia dots. The position of −10 boxes attributed to 5′‐RACE peaks are indicated by green and orange rectangles for positive and negative DNA strands, respectively. The genomic coordinates containing the identified TSSs and −10 boxes is enlarged and its corresponding DNA sequence is illustrated. Bases corresponding to +1 sites are colored in red. Bases corresponding to the −10 boxes are highlighted in green and orange for positive and negative DNA strands.
