
Figure 5. Expression levels of M. florum protein‐coding genes and enrichment of functional categories.
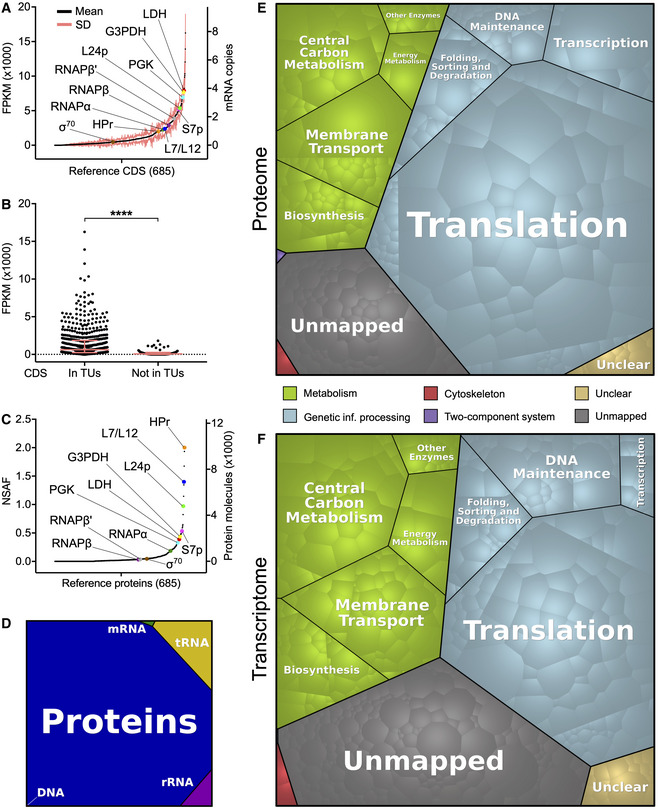
- Transcription levels of all M. florum coding sequences (CDS) quantified by RNA‐seq. Transcription levels were calculated according to the number of fragments per kilobase per million of mapped reads (FPKM) observed over six replicates. The corresponding numbers of mRNA copies per cell, estimated from the measured M. florum RNA mass, are also indicated. CDS were sorted from least to most transcribed. The transcription level of selected genes of importance is presented. LDH, L‐lactate dehydrogenase (peg.600/mfl596); G3PDH, glyceraldehyde‐3‐phosphate dehydrogenase (peg.583/mfl578); PGK, phosphoglycerate kinase (peg.582/mfl577); L24p and L7/L12, large subunit ribosomal proteins L24p (peg.133/mfl134) and L7/L12 (peg.605/mfl601); S7p, small subunit ribosomal protein S7p (peg.626/mfl623); RNAPβ, RNAPβ′, and RNAPα, RNA polymerase subunits β, β′, and α (peg.601/mfl597, peg.602/mfl598, and peg.149/mfl150); HPr, phosphotransferase system phosphocarrier protein HPr (peg.570/mfl565); σ70, RNA polymerase sigma factor RpoD (peg.269/mfl270).
- Transcription level of CDS included in transcription units (TUs) compared with CDS not attributed to any TU (orphan CDS). The median and interquartile range are shown for both groups. The mean rank of each group was compared using a Mann–Whitney test (two‐sided, ****P‐value < 0.0001).
- Expression levels of all M. florum reference proteins quantified by two‐dimensional liquid chromatography‐tandem mass spectrometry (2D LC‐MS/MS). Abundance was estimated according to the normalized spectral abundance factor (NSAF) calculated for each protein. A NSAF value of 0 was assigned to undetected proteins. The corresponding number of protein molecules per cell (derived from the biomass data) is indicated. Proteins were sorted from least to most abundant. The selected genes of importance presented in panel A are also highlighted.
- Overall DNA, tRNA, rRNA, mRNA, and protein proportions in terms of intracellular abundances in M. florum.
- Voronoi diagram illustrating the relative abundance of M. florum reference proteins grouped into different functional categories. Each polygon represents a specific protein weighted by its expression level quantified by 2D LC‐MS/MS. Functions were attributed based on the KEGG Orthology (KO) database (Kanehisa et al, 2016a). The unmapped category regroups proteins for which no KO identifier could be assigned, while the unclear category contains proteins with KO numbers matching to unclear functions.
- As panel E but for mRNA abundances quantified by RNA‐seq.