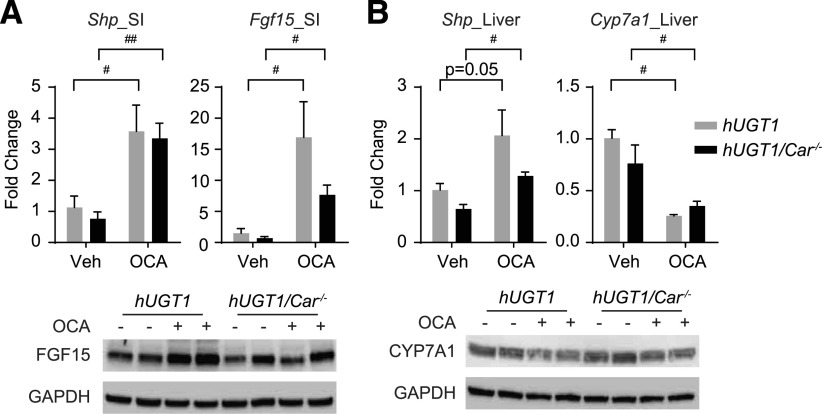
Fig. 4.
OCA treatment promotes FXR target gene induction. (A) Total RNA and cellular extracts were prepared from small intestine and liver of hUGT1 and hUGT1/Car−/− neonatal mice. (A) Shp and Fgf15 gene expression from small intestines was determined by RT-qPCR. Cellular extracts were prepared for Western blot analysis to examine FGF15 protein expression. (B) Liver Shp and Cyp7a1 gene expression was determined by RT-qPCR, and Cyp7a1 protein expression was examined by Western blot analysis. The bands have been cropped, and the full-length blots are in Supplemental Material. Values are means ± S.D. (n ≥ 3). Statistically significant differences between vehicle (Veh) and OCA are indicated by asterisks (Student’s t test: #P < 0.05; ##P < 0.01; between treatments). RT-qPCR, reverse-transcription quantitative polymerase chain reaction.

