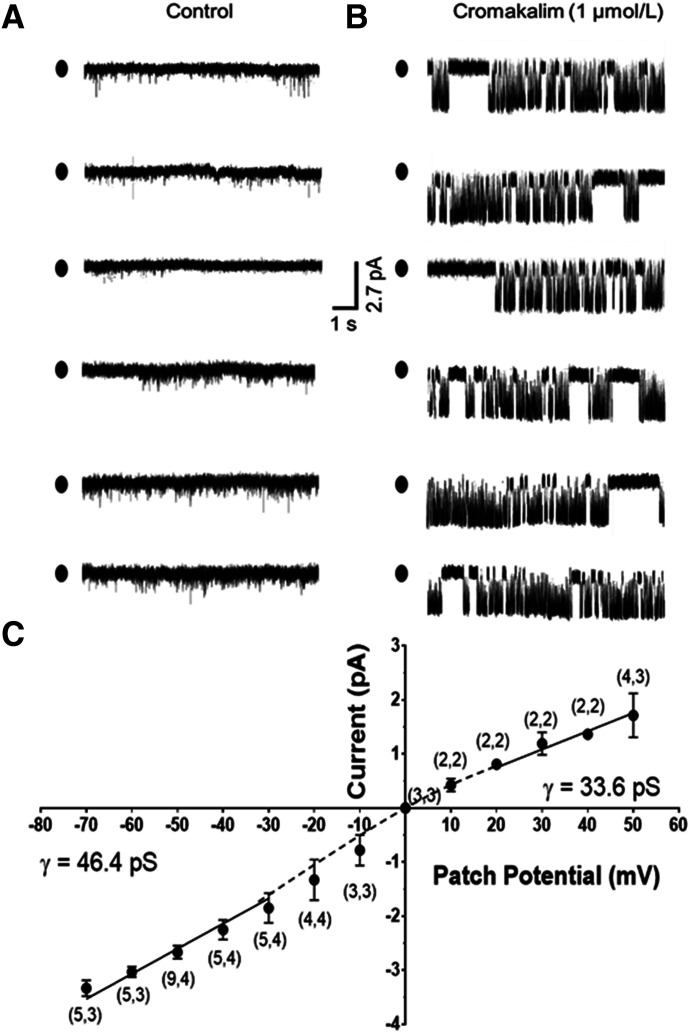
Fig. 7.
Patch recordings of cromakalim-elicited K+ currents. (A) Cell-attached recording fails to reveal unitary K+ currents at a patch potential of −50 mV. (B) The same recording as in (A) after addition of 1 µmol/l cromakalim reveals channel activity. (C) A plot of single-channel current amplitude as a function of patch potential depicts an avg. unitary conductance of 46.4 pS at negative patch potentials between −70 and −30 mV. Mild inward rectification results in a unitary conductance of 33.6 pS at positive patch potentials (+20 to +50 mV). Filled ovals located at the left of each trace represent the closed state. Data are reported as mean ± S.D. (X,X) = (number cells, number of cell isolations from different animals).

