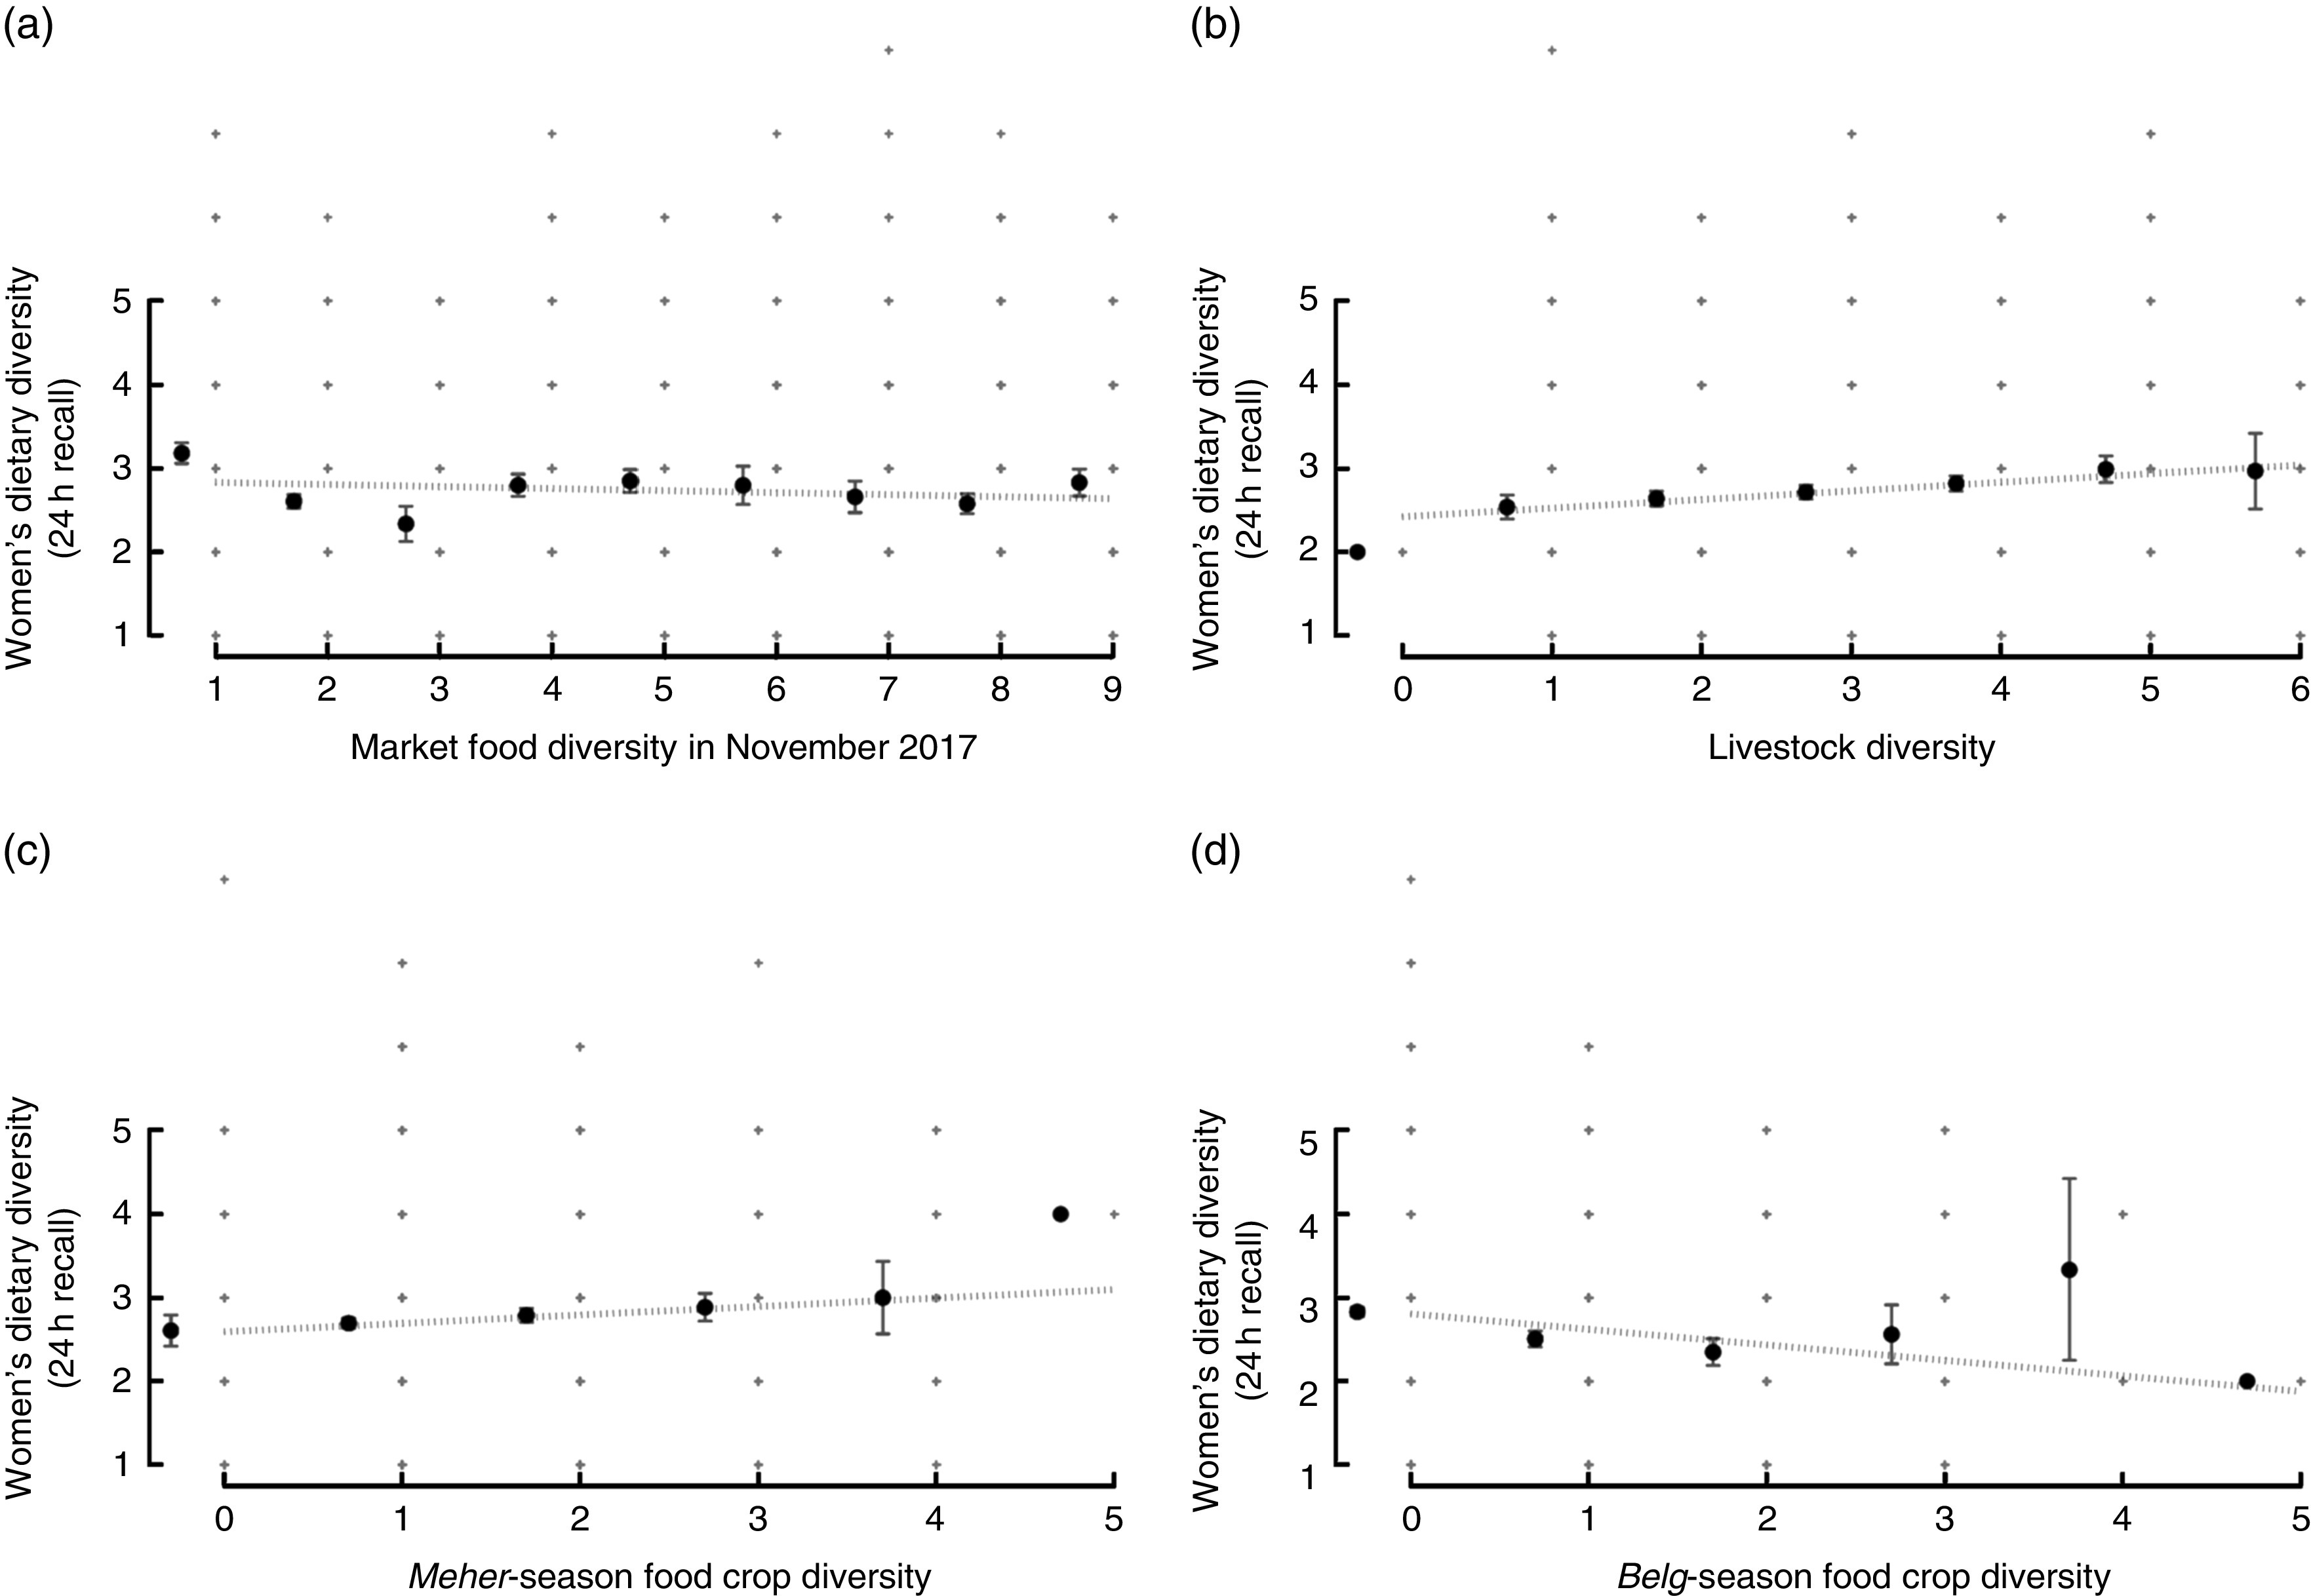
Fig. 2.

Relationship between women’s dietary diversity in the previous 24h and (a) market food diversity in November 2017, (b) livestock diversity, (c) food crop diversity in Meher season and (d) food crop diversity in Belg season; Agriculture to Nutrition (ATONU) study, rural Ethiopia, November 2016–January 2017. Values are means ( ), with their standard errors represented by vertical bars;
  represent the range of dietary diversity scores. Slope and P value from bivariate models adjusted for kebele: (a) slope=–0·02, P=0·286; (b) slope=0·10, P<0·001; (c) slope=0·13, P<0·001; (d) slope=0·05, P=0·179
