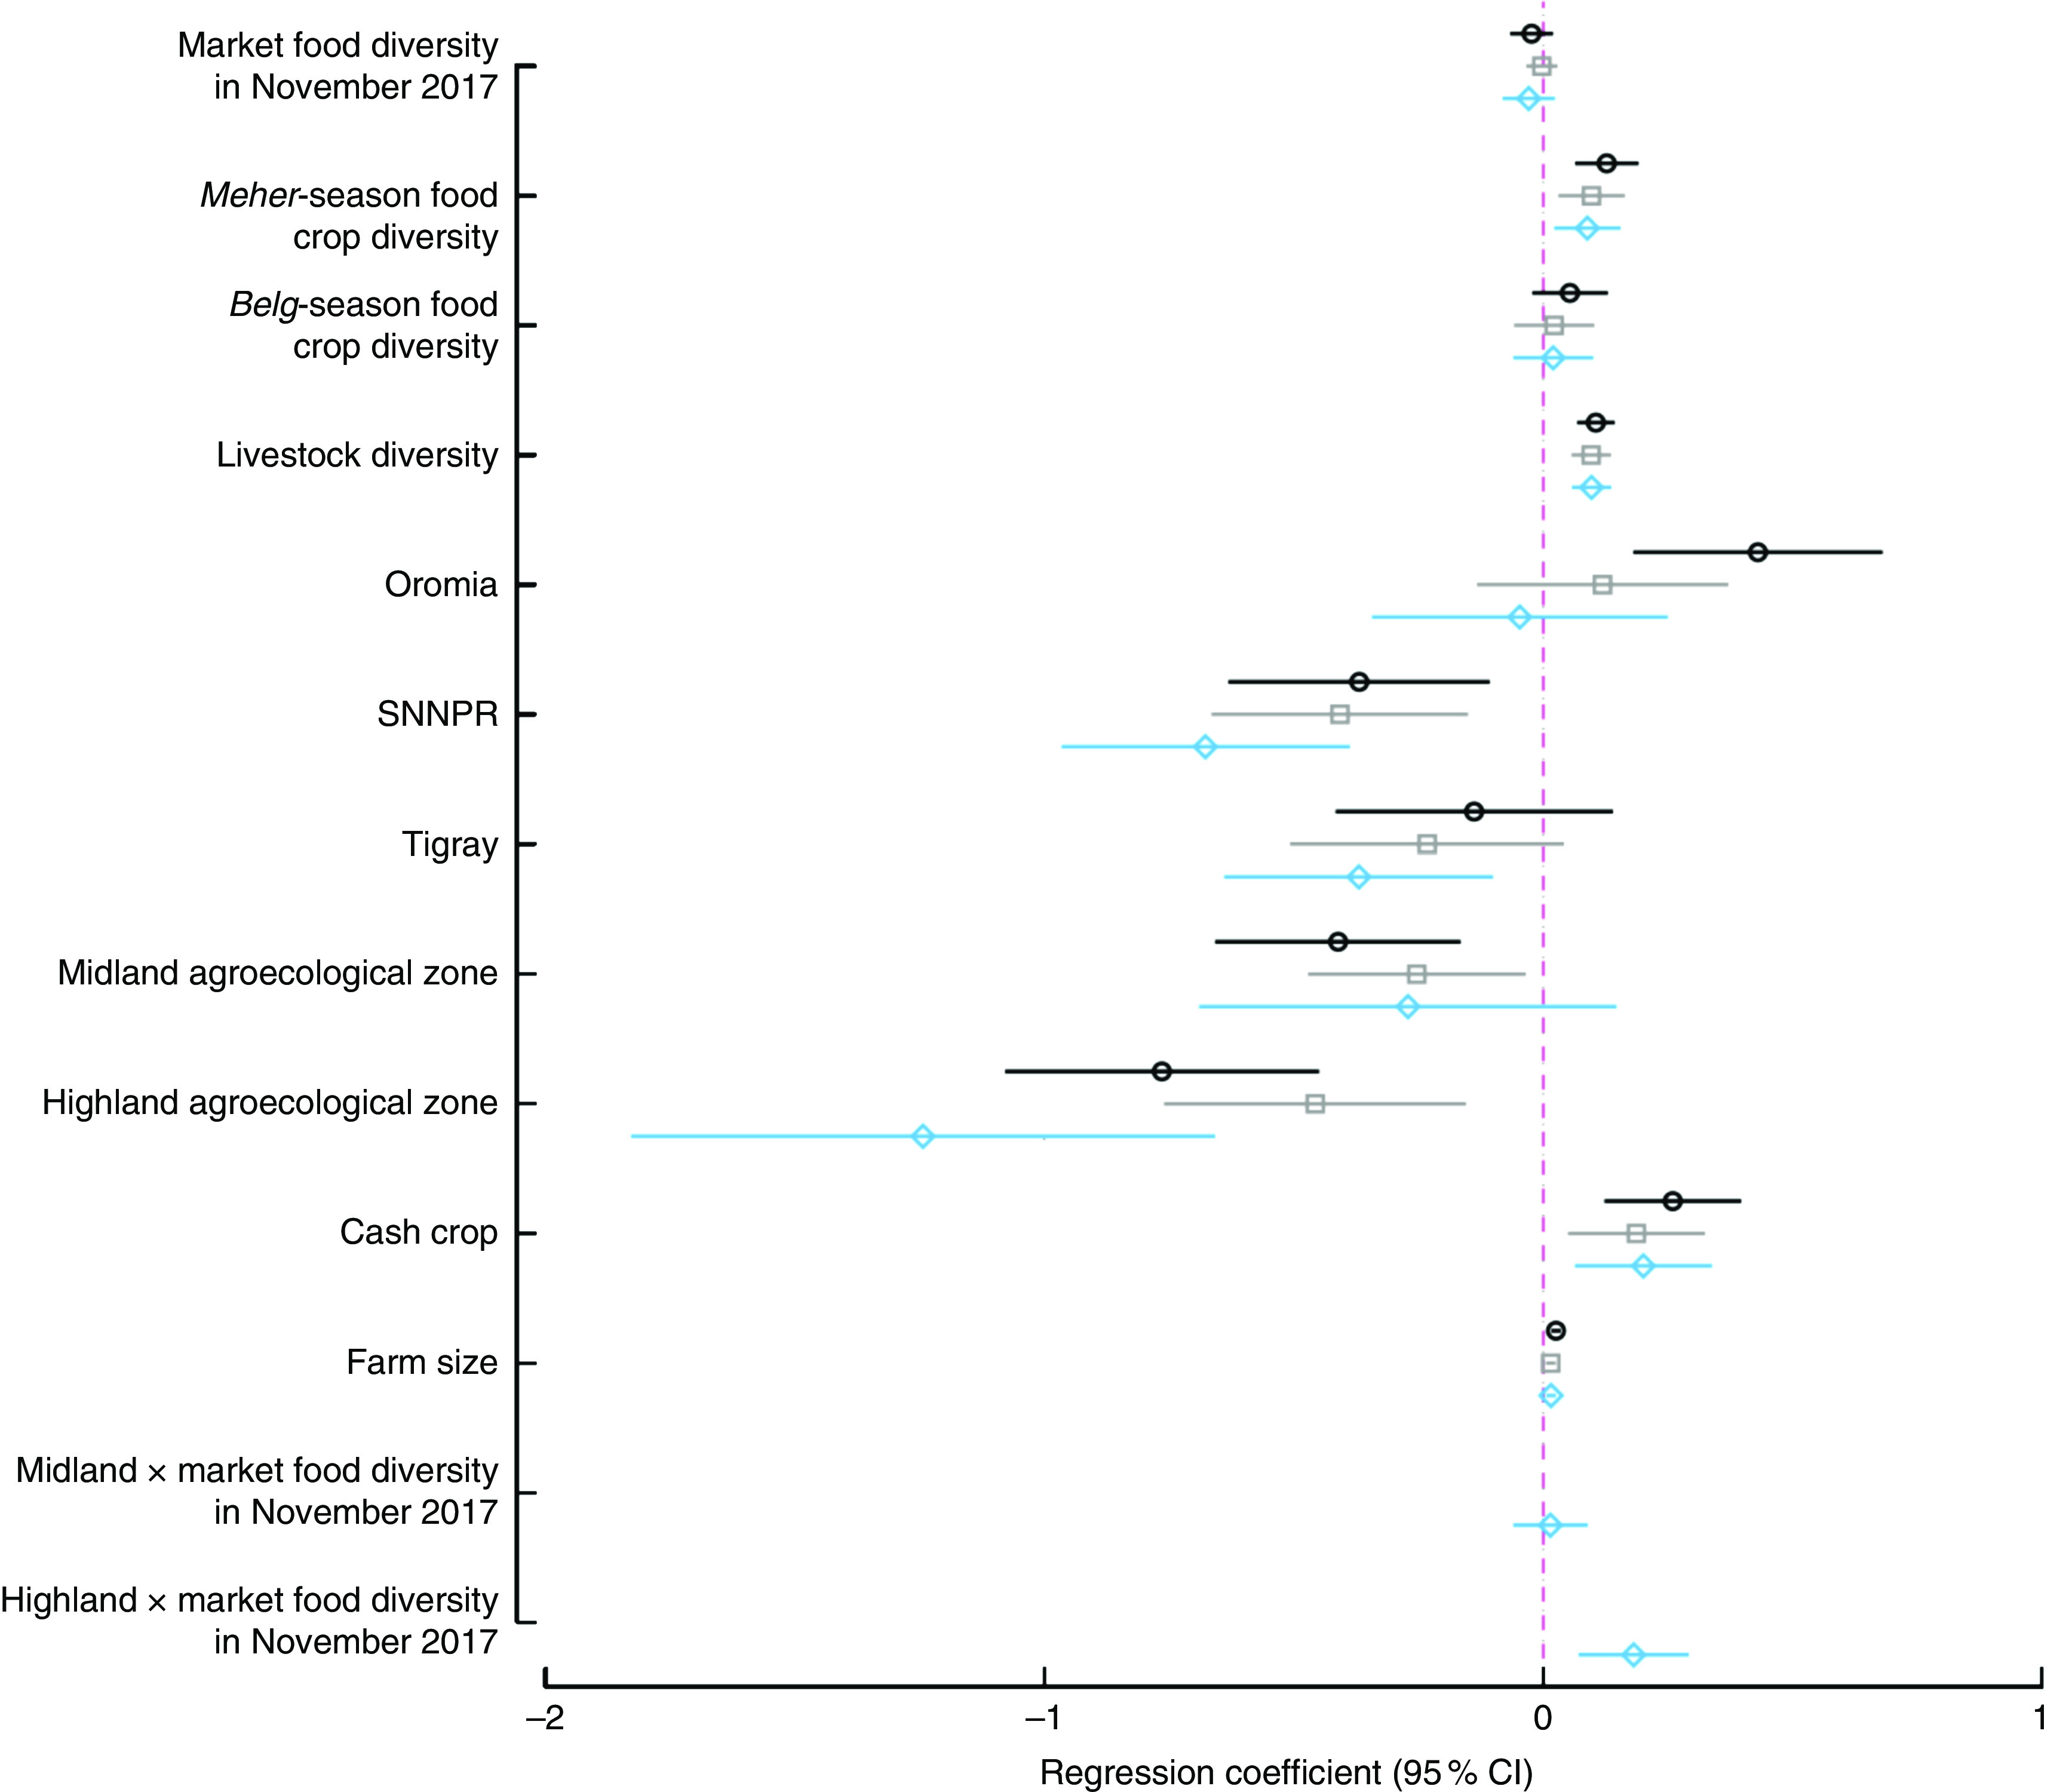
Fig. 3.

Regression results from models examining the effect of market food, food crop and livestock diversity, region and agroecological zone on women’s dietary diversity; Agriculture to Nutrition (ATONU) study, rural Ethiopia, November 2016–January 2017. Values are regression coefficients, with their 95 % CI represented by horizontal bars, from bivariate models ( ), multivariate models without interaction terms (
 ) and multivariate models with interaction terms (
 ). Multivariate models adjusted for region, education, women’s education, wealth quintiles, woman’s age, age of the household head, household size, access to improved water and sanitation, and kebele-level clustering (SNNPR, Southern Nations, Nationalities and Peoples’ Region). Other coefficients are presented in the online supplementary material, Supplemental Table 3
