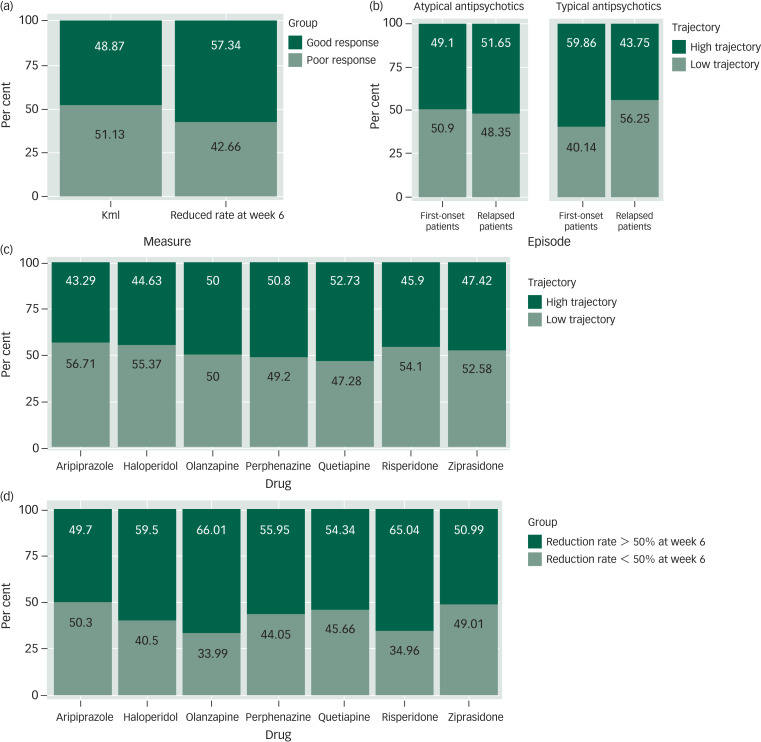
Fig. 3.
Comparison of findings using the trajectory analysis and dichomtomous threshold methods. (a) The proportion of patients using trajectory analysis and dichotomous thresholds methods for a good response (dark green) versus a poor response (light green). (b) The proportion of patients in a first-episode and patients who relapsed by trajectories (high or low). Data for patients treated with atypical antipsychotics and typical antipsychotics are shown separately. (c) The proportion of patients taking each of the seven antipsychotic drugs by trajectories (high or low). (d) The proportion of patients taking each of seven antipsychotic drugs by dichotomous thresholds methods. Reduction rate at week 6 >50% or <50%.
Percentage figures are indicated within bars.

